> ## Documentation Index
> Fetch the complete documentation index at: https://docs.kubestacks.com/llms.txt
> Use this file to discover all available pages before exploring further.
# Logs
> Stream a pod's logs as they're written, or every pod of a workload or service merged in order, then search, filter and download what you see.
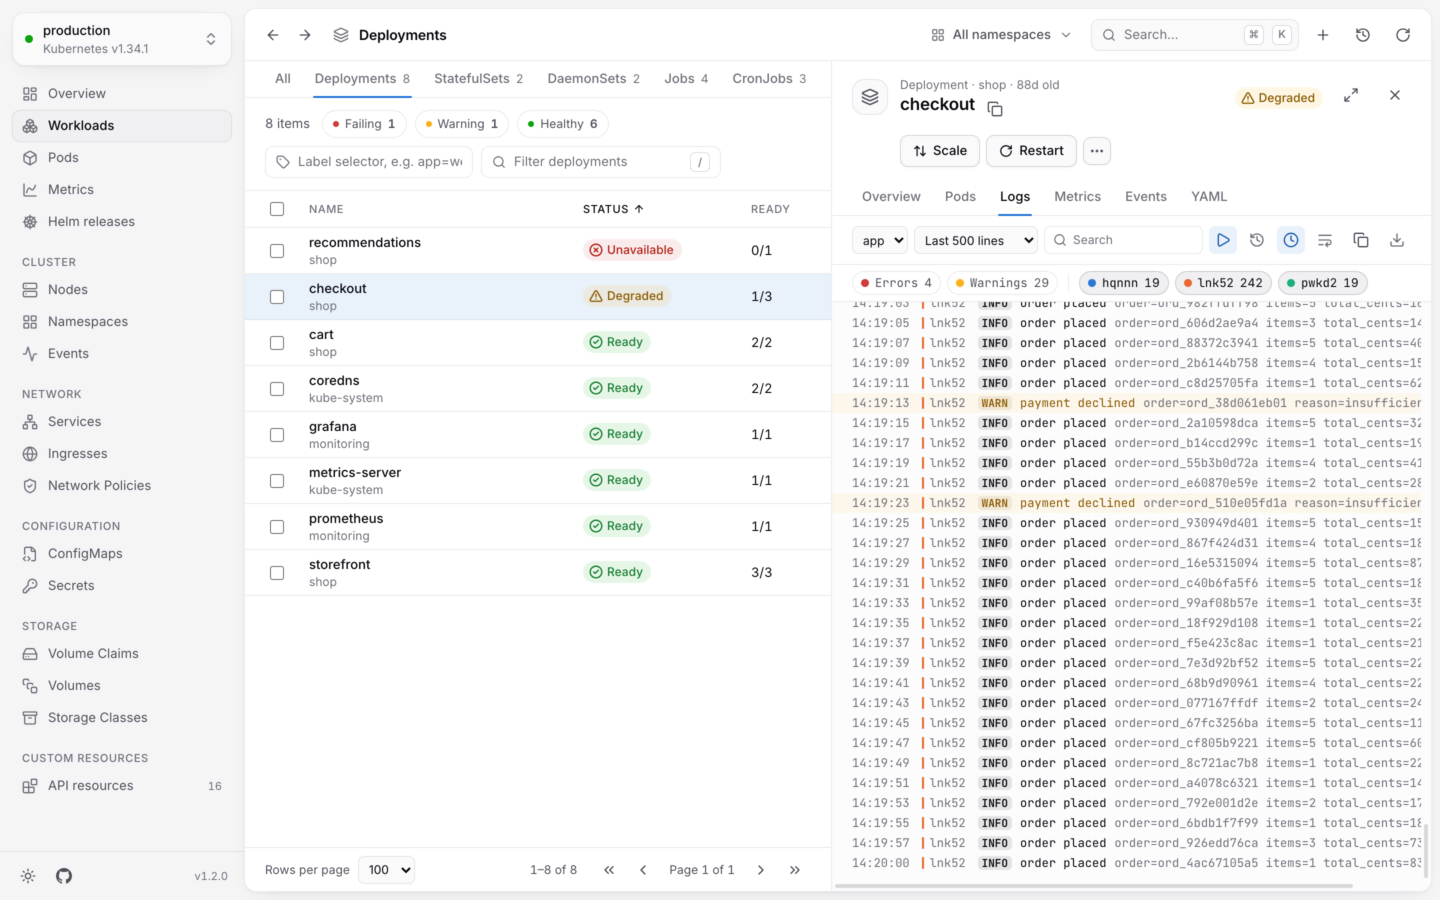
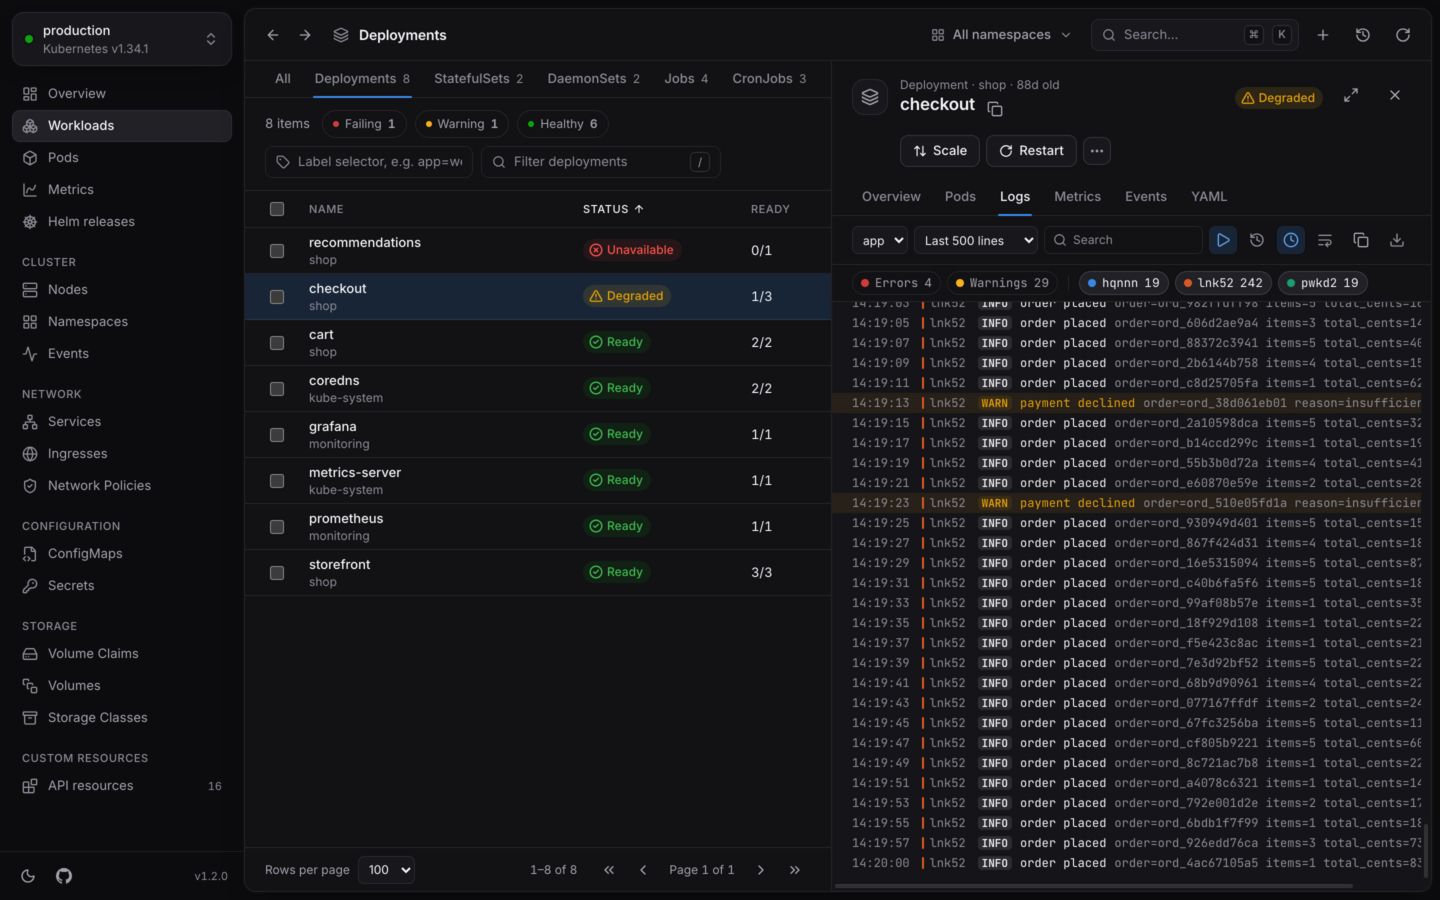
Logs stream as they're written, like `kubectl logs -f`. For a workload, you get every pod's logs in one list, in the order the lines were written, each marked with its pod.
 ## Where logs are
Open an object, then its **Logs** tab:
* **A pod** shows its own containers' logs.
* **A Deployment, StatefulSet, DaemonSet, ReplicaSet, Job or Service** shows the logs of all its pods, merged. So do custom workloads that scale pods, like Argo Rollouts.
Pods that start later join in, and a pod that goes away keeps the lines it wrote. Nodes don't have a Logs tab: that would be everything on the node.
Need the command instead? Right-click a pod in any list and choose **Copy kubectl logs**.
## Pick what to show
| Control | Does |
| - | - |
| **Container** | Which container's logs to show. Init containers come first. With more than one container, **All containers** streams them all. It starts on the first container of the first pod. |
| **Show** | How far back to start: **Last 100 lines**, **Last 500 lines** (the default), **Last 2,000 lines**, **Last 5 minutes**, **Last hour** or **Last day**. |
| **Previous container** | The logs of the container's previous run, like `kubectl logs --previous`. Use it for a container that crashed and restarted: its last words are usually in the run before. These don't follow, since that run has ended. |
## Read them
| Toggle | Does |
| - | - |
| **Follow** | Keeps streaming new lines as they're written. On by default. |
| **Timestamps** | Shows when each line was written, in your local time. On by default. |
| **Wrap lines** | Wraps long lines instead of scrolling sideways. |
When you scroll up to read, the view stops jumping to new lines, and **Jump to latest** takes you back down.
* **Colors.** The colors and styles apps print with ANSI escape codes show as they would in a terminal: 16, 256 and true colors, bold, dim, italic and underline. Other escape codes are left out.
* **JSON lines.** Structured lines show their level as a badge, then the message, then the other fields, dimmed, as `key=value`.
## Search and filter
* **Search** finds lines that contain what you type, ignoring case. Matches are highlighted, with a count of the lines shown. Esc clears it.
* **Errors** and **Warnings** appear when there are such lines, with a count. Press one to show only those lines; with neither pressed, every line shows.
* **A chip per pod** appears when there are several pods, with the part of the names they share left out. Press one to leave that pod's lines out; it shows crossed out until you press it again.
KubeStacks reads a line's level from its `level` field when it has one (`"level":"warn"` in JSON, or `level=WARN`). Otherwise it looks for words in the line:
| Level | Words |
| - | - |
| Error | error, fatal, panic, crit, critical, exception |
| Warning | warn, warning |
## Copy and download
**Copy logs** and **Download** take the lines you're looking at, filters applied, one per line, each starting with the time it was written. When the lines come from several pods or containers, each also names its pod and container:
```text theme={"theme":{"light":"github-light","dark":"github-dark-default"}}
2026-10-02T09:14:03.512345678Z checkout-7d9f8-hqnnn/app payment provider timed out
```
Downloads are named after the object, like `checkout.log`. The desktop app asks where to save them, starting in your Downloads folder; in a browser, they download like any other file.
## Limits
* **20,000 lines.** The view keeps the latest 20,000 lines, and drops the oldest. It says so when it does.
* **30 streams.** A workload's logs stream from at most 30 containers at once. With more, a note says so: pick a container, or open a single pod, to see the rest.
## When the stream drops
While following, if a container restarts or the connection drops, KubeStacks tries again after a few seconds, picking up from the last line it has, without repeating lines. The view says **Trying again…** meanwhile. Problems that trying again won't fix, like expired credentials or missing permissions, are shown instead.
Reading logs needs `get` on `pods/log` in the pod's namespace. Logs work in [read-only](/changes/read-only) clusters.
When the logs aren't enough: a terminal in the container.
Why a pod is failing, before you open its logs.
This documentation is built and hosted on [Mintlify](https://mintlify.com), a developer documentation platform.
## Where logs are
Open an object, then its **Logs** tab:
* **A pod** shows its own containers' logs.
* **A Deployment, StatefulSet, DaemonSet, ReplicaSet, Job or Service** shows the logs of all its pods, merged. So do custom workloads that scale pods, like Argo Rollouts.
Pods that start later join in, and a pod that goes away keeps the lines it wrote. Nodes don't have a Logs tab: that would be everything on the node.
Need the command instead? Right-click a pod in any list and choose **Copy kubectl logs**.
## Pick what to show
| Control | Does |
| - | - |
| **Container** | Which container's logs to show. Init containers come first. With more than one container, **All containers** streams them all. It starts on the first container of the first pod. |
| **Show** | How far back to start: **Last 100 lines**, **Last 500 lines** (the default), **Last 2,000 lines**, **Last 5 minutes**, **Last hour** or **Last day**. |
| **Previous container** | The logs of the container's previous run, like `kubectl logs --previous`. Use it for a container that crashed and restarted: its last words are usually in the run before. These don't follow, since that run has ended. |
## Read them
| Toggle | Does |
| - | - |
| **Follow** | Keeps streaming new lines as they're written. On by default. |
| **Timestamps** | Shows when each line was written, in your local time. On by default. |
| **Wrap lines** | Wraps long lines instead of scrolling sideways. |
When you scroll up to read, the view stops jumping to new lines, and **Jump to latest** takes you back down.
* **Colors.** The colors and styles apps print with ANSI escape codes show as they would in a terminal: 16, 256 and true colors, bold, dim, italic and underline. Other escape codes are left out.
* **JSON lines.** Structured lines show their level as a badge, then the message, then the other fields, dimmed, as `key=value`.
## Search and filter
* **Search** finds lines that contain what you type, ignoring case. Matches are highlighted, with a count of the lines shown. Esc clears it.
* **Errors** and **Warnings** appear when there are such lines, with a count. Press one to show only those lines; with neither pressed, every line shows.
* **A chip per pod** appears when there are several pods, with the part of the names they share left out. Press one to leave that pod's lines out; it shows crossed out until you press it again.
KubeStacks reads a line's level from its `level` field when it has one (`"level":"warn"` in JSON, or `level=WARN`). Otherwise it looks for words in the line:
| Level | Words |
| - | - |
| Error | error, fatal, panic, crit, critical, exception |
| Warning | warn, warning |
## Copy and download
**Copy logs** and **Download** take the lines you're looking at, filters applied, one per line, each starting with the time it was written. When the lines come from several pods or containers, each also names its pod and container:
```text theme={"theme":{"light":"github-light","dark":"github-dark-default"}}
2026-10-02T09:14:03.512345678Z checkout-7d9f8-hqnnn/app payment provider timed out
```
Downloads are named after the object, like `checkout.log`. The desktop app asks where to save them, starting in your Downloads folder; in a browser, they download like any other file.
## Limits
* **20,000 lines.** The view keeps the latest 20,000 lines, and drops the oldest. It says so when it does.
* **30 streams.** A workload's logs stream from at most 30 containers at once. With more, a note says so: pick a container, or open a single pod, to see the rest.
## When the stream drops
While following, if a container restarts or the connection drops, KubeStacks tries again after a few seconds, picking up from the last line it has, without repeating lines. The view says **Trying again…** meanwhile. Problems that trying again won't fix, like expired credentials or missing permissions, are shown instead.
Reading logs needs `get` on `pods/log` in the pod's namespace. Logs work in [read-only](/changes/read-only) clusters.
When the logs aren't enough: a terminal in the container.
Why a pod is failing, before you open its logs.
This documentation is built and hosted on [Mintlify](https://mintlify.com), a developer documentation platform.