> ## Documentation Index
> Fetch the complete documentation index at: https://docs.kubestacks.com/llms.txt
> Use this file to discover all available pages before exploring further.
# Overview
> A cluster's health and capacity on one page: what's running, what needs attention, and where CPU and memory go.
The overview is where every cluster opens. In a few seconds it tells you whether the cluster is healthy, and if it isn't, where to look first. Open it any time with G then O, or ⌘1 in the desktop app (Ctrl1 on Windows and Linux).
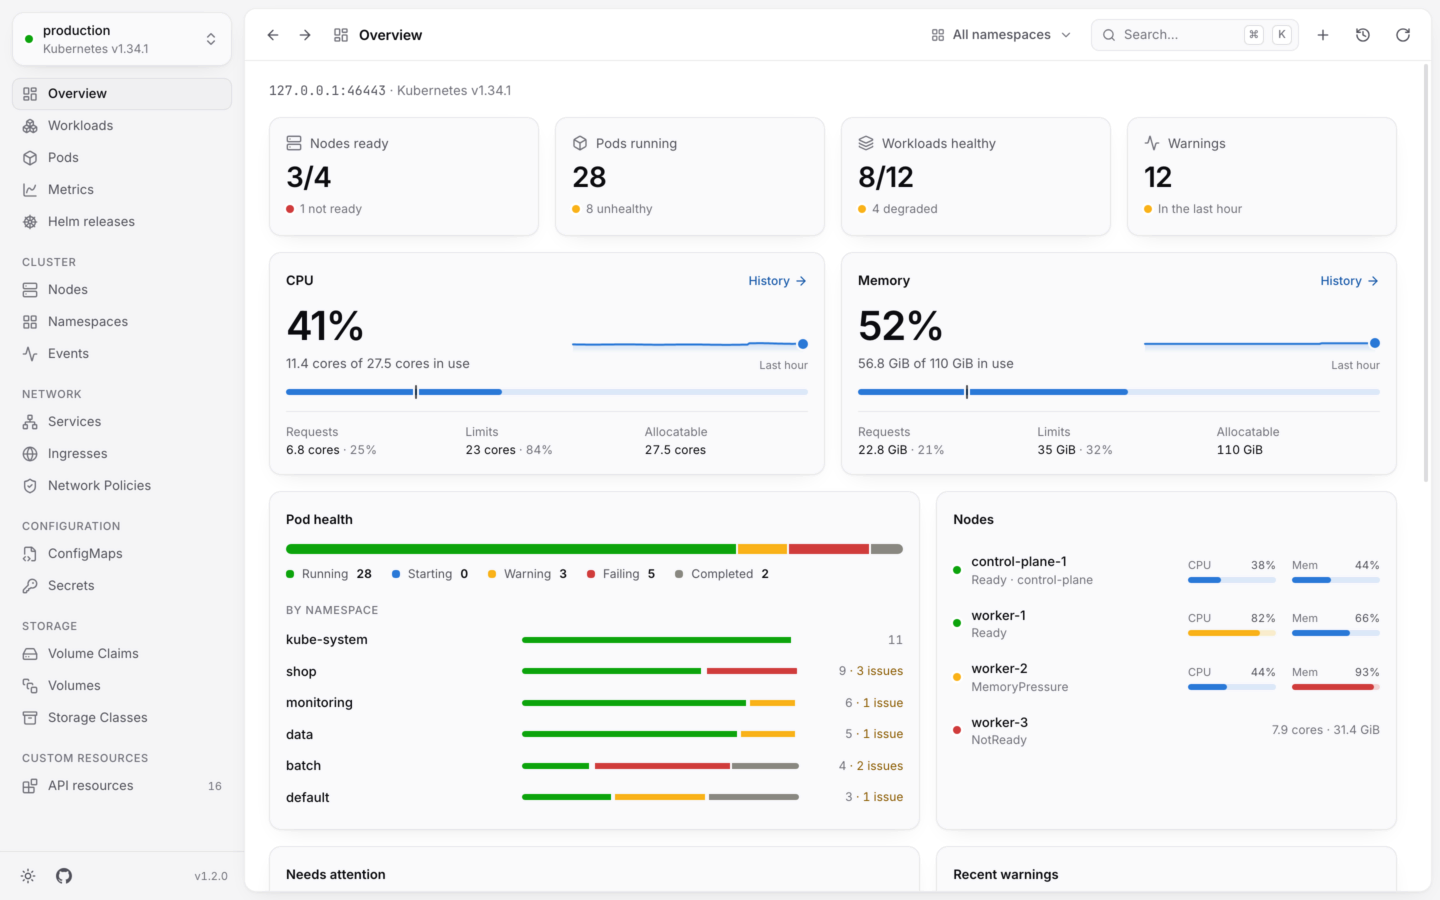
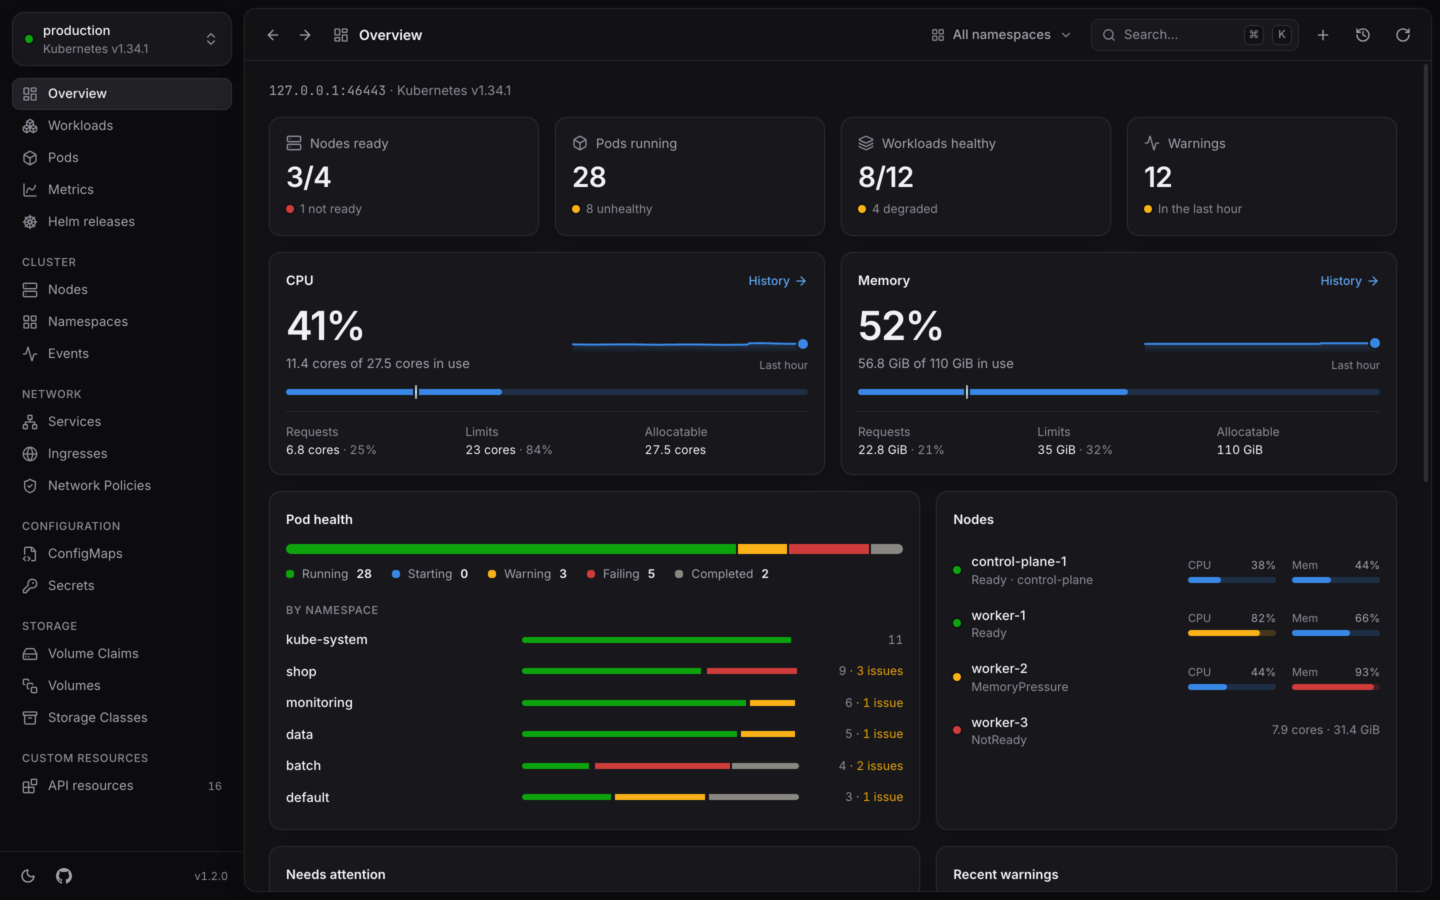 The line at the top names the API server and its Kubernetes version. Nodes and capacity are always the whole cluster's. Workloads, pods and events follow the [namespace](/clusters/namespaces) you picked.
## The four numbers
| Tile | Shows | Below it |
| - | - | - |
| **Nodes ready** | Ready nodes, of all nodes | **All ready**, or how many aren't |
| **Pods running** | How many pods are running | How many are unhealthy, or that they're all fine |
| **Workloads healthy** | Healthy Deployments, StatefulSets and DaemonSets, of all of them | **All healthy**, or how many are degraded |
| **Warnings** | Warning events seen in the last hour | **In the last hour** |
Each tile opens its list. When something's wrong, the list opens filtered to what's failing or warning, so the problems are all you see. **Warnings** opens the events, showing only warnings.
## CPU and memory
Two cards show how much of the cluster's CPU and memory is in use, as a percentage of what the nodes can give (their allocatable capacity), and as *11.4 cores of 27.5 cores in use*.
* **The meter** shows usage, with a mark for what pods have requested.
* **The sparkline** shows the **Last hour** when KubeStacks has found your [usage history](/metrics/usage-history), or the usage **Since you opened it** when it hasn't.
* **Requests**, **Limits** and **Allocatable** add up what every pod asks for and is capped at, against what the nodes offer. Requests and limits also show as a share of allocatable.
* **History**, shown once usage history is found, opens the [Metrics page](/metrics/usage-history) for a longer view.
Live usage comes from [metrics-server](/metrics/live-usage). Without it, the cards say **Live usage needs metrics-server** and show what's requested instead: *6.8 cores of 27.5 cores requested*.
## Pod health
A bar shows every pod by state: **Running**, **Starting**, **Warning**, **Failing** and **Completed**, with a count for each. Under it, **By namespace** shows the six namespaces with the most pods the same way, with how many issues each has, so a namespace in trouble stands out. Click a namespace to switch to it.
## Nodes
Every node with its status and roles, and meters for its CPU and memory use (or its allocatable CPU and memory, without metrics-server). A node under pressure, cordoned or not ready says so. Click one to open it. See [Nodes](/explore/nodes).
## Needs attention
The pods and workloads (Deployments, StatefulSets and DaemonSets) that aren't healthy, most urgent first. It shows six, with **Show all** for the rest. Click one to open it. When nothing's wrong, it says *Everything looks healthy.*
## Recent warnings
The six latest warning events, with their reason and message. Click one to open the object it's about. When there are none: *No warnings. Nice.*
## Top CPU and Top memory
The five pods using the most CPU, and the five using the most memory, right now. They're often the first place to look when a node is under pressure. These need metrics-server, and appear once pods report usage.
The overview refreshes on its own. Press ⌘R to refresh it now.
How KubeStacks decides what's healthy, and what each status means.
Every workload in one list, problems first.
This documentation is built and hosted on [Mintlify](https://mintlify.com), a developer documentation platform.
The line at the top names the API server and its Kubernetes version. Nodes and capacity are always the whole cluster's. Workloads, pods and events follow the [namespace](/clusters/namespaces) you picked.
## The four numbers
| Tile | Shows | Below it |
| - | - | - |
| **Nodes ready** | Ready nodes, of all nodes | **All ready**, or how many aren't |
| **Pods running** | How many pods are running | How many are unhealthy, or that they're all fine |
| **Workloads healthy** | Healthy Deployments, StatefulSets and DaemonSets, of all of them | **All healthy**, or how many are degraded |
| **Warnings** | Warning events seen in the last hour | **In the last hour** |
Each tile opens its list. When something's wrong, the list opens filtered to what's failing or warning, so the problems are all you see. **Warnings** opens the events, showing only warnings.
## CPU and memory
Two cards show how much of the cluster's CPU and memory is in use, as a percentage of what the nodes can give (their allocatable capacity), and as *11.4 cores of 27.5 cores in use*.
* **The meter** shows usage, with a mark for what pods have requested.
* **The sparkline** shows the **Last hour** when KubeStacks has found your [usage history](/metrics/usage-history), or the usage **Since you opened it** when it hasn't.
* **Requests**, **Limits** and **Allocatable** add up what every pod asks for and is capped at, against what the nodes offer. Requests and limits also show as a share of allocatable.
* **History**, shown once usage history is found, opens the [Metrics page](/metrics/usage-history) for a longer view.
Live usage comes from [metrics-server](/metrics/live-usage). Without it, the cards say **Live usage needs metrics-server** and show what's requested instead: *6.8 cores of 27.5 cores requested*.
## Pod health
A bar shows every pod by state: **Running**, **Starting**, **Warning**, **Failing** and **Completed**, with a count for each. Under it, **By namespace** shows the six namespaces with the most pods the same way, with how many issues each has, so a namespace in trouble stands out. Click a namespace to switch to it.
## Nodes
Every node with its status and roles, and meters for its CPU and memory use (or its allocatable CPU and memory, without metrics-server). A node under pressure, cordoned or not ready says so. Click one to open it. See [Nodes](/explore/nodes).
## Needs attention
The pods and workloads (Deployments, StatefulSets and DaemonSets) that aren't healthy, most urgent first. It shows six, with **Show all** for the rest. Click one to open it. When nothing's wrong, it says *Everything looks healthy.*
## Recent warnings
The six latest warning events, with their reason and message. Click one to open the object it's about. When there are none: *No warnings. Nice.*
## Top CPU and Top memory
The five pods using the most CPU, and the five using the most memory, right now. They're often the first place to look when a node is under pressure. These need metrics-server, and appear once pods report usage.
The overview refreshes on its own. Press ⌘R to refresh it now.
How KubeStacks decides what's healthy, and what each status means.
Every workload in one list, problems first.
This documentation is built and hosted on [Mintlify](https://mintlify.com), a developer documentation platform.