> ## Documentation Index
> Fetch the complete documentation index at: https://docs.kubestacks.com/llms.txt
> Use this file to discover all available pages before exploring further.
# Pods
> Every pod, its status and restarts, with the failing ones first, and everything about each one a click away.
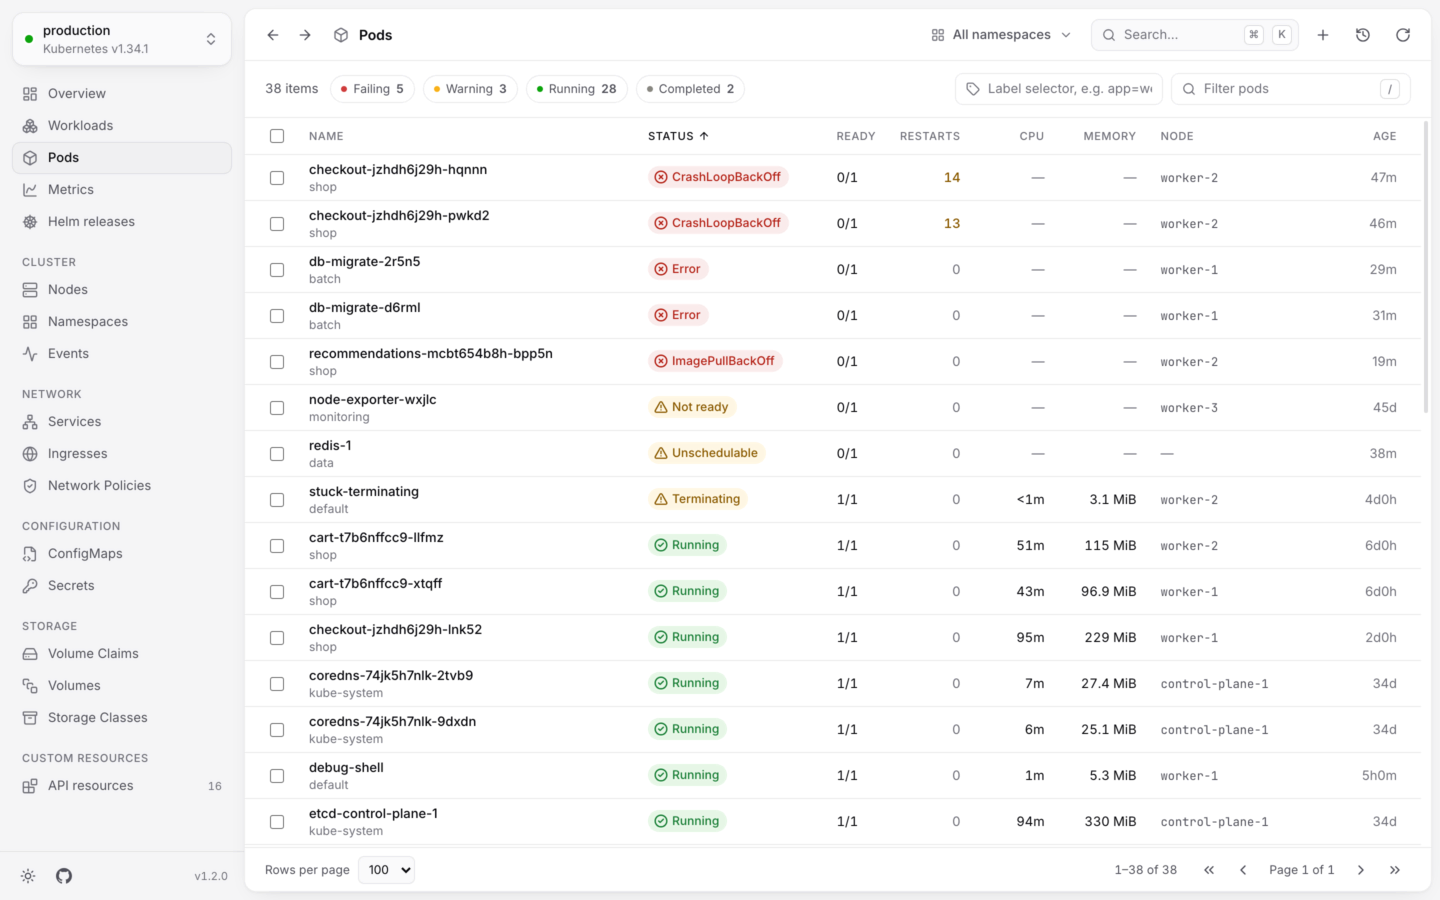
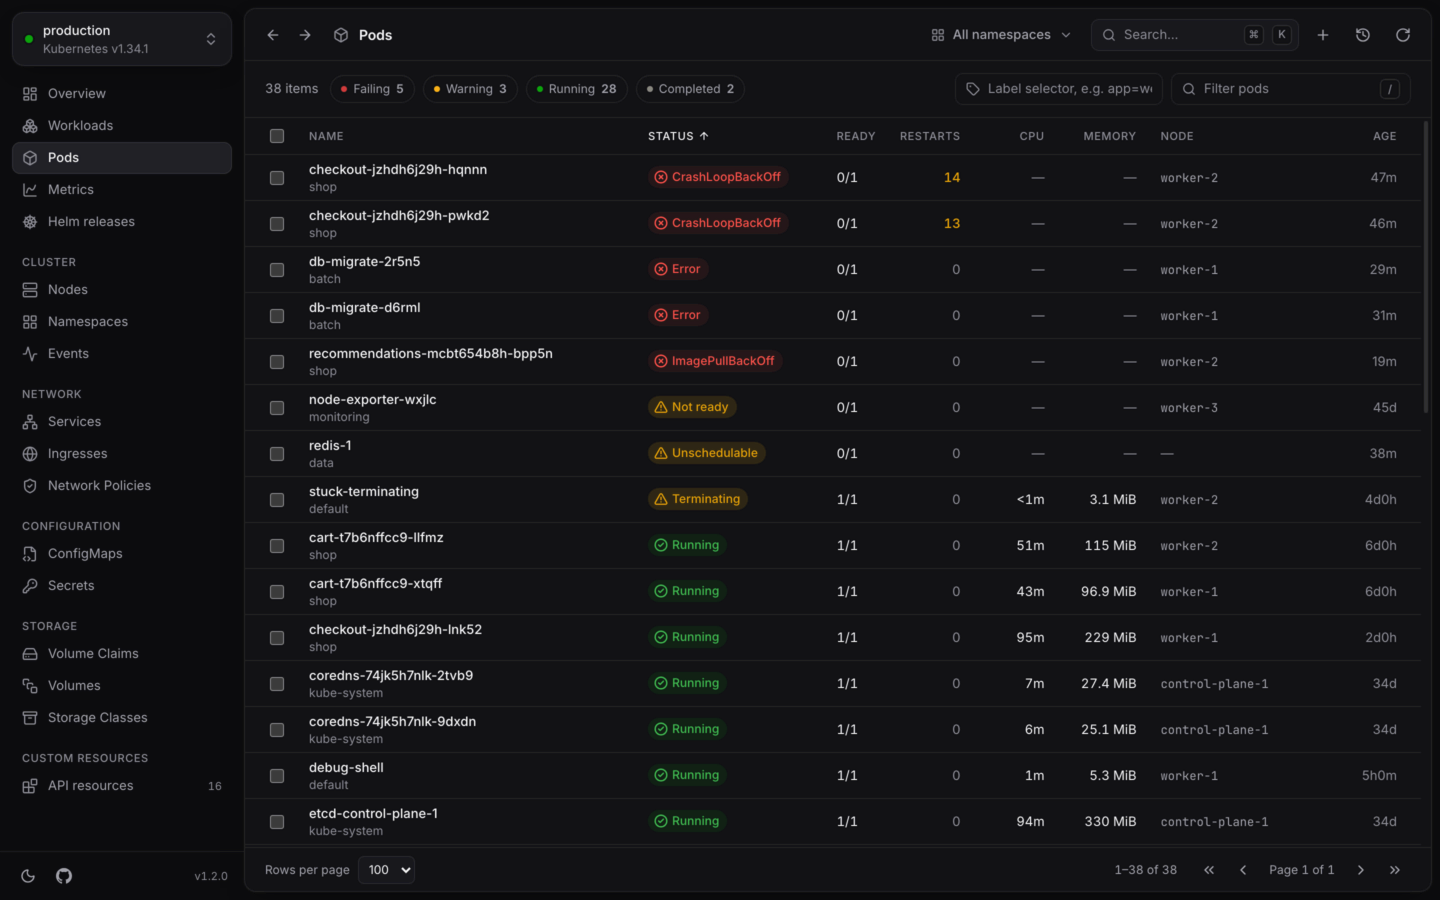
**Pods** lists every pod in the namespace you picked, failing ones first. Open it from the sidebar, with G then P, or with ⌘3 in the desktop app (Ctrl3 on Windows and Linux).
 ## The list
| Column | Shows |
| - | - |
| **Status** | What the pod is doing, in words: Running, CrashLoopBackOff, Unschedulable, ContainerCreating… |
| **Ready** | Ready containers, of all of them |
| **Restarts** | How many times its containers restarted |
| **CPU**, **Memory** | Live usage, from [metrics-server](/metrics/live-usage) |
| **Node** | The node it runs on |
| **Age** | How long ago it was created |
The status is the most specific reason KubeStacks can find: a container's waiting reason (like `ImagePullBackOff`), why a pod failed (like `OOMKilled` or `Evicted`), or why it can't be scheduled. Hover it for the message behind it. [Health and status](/explore/health) lists them all.
## Open a pod
Click a row, or move to it with ↑ ↓ and press ↵.
## The list
| Column | Shows |
| - | - |
| **Status** | What the pod is doing, in words: Running, CrashLoopBackOff, Unschedulable, ContainerCreating… |
| **Ready** | Ready containers, of all of them |
| **Restarts** | How many times its containers restarted |
| **CPU**, **Memory** | Live usage, from [metrics-server](/metrics/live-usage) |
| **Node** | The node it runs on |
| **Age** | How long ago it was created |
The status is the most specific reason KubeStacks can find: a container's waiting reason (like `ImagePullBackOff`), why a pod failed (like `OOMKilled` or `Evicted`), or why it can't be scheduled. Hover it for the message behind it. [Health and status](/explore/health) lists them all.
## Open a pod
Click a row, or move to it with ↑ ↓ and press ↵.
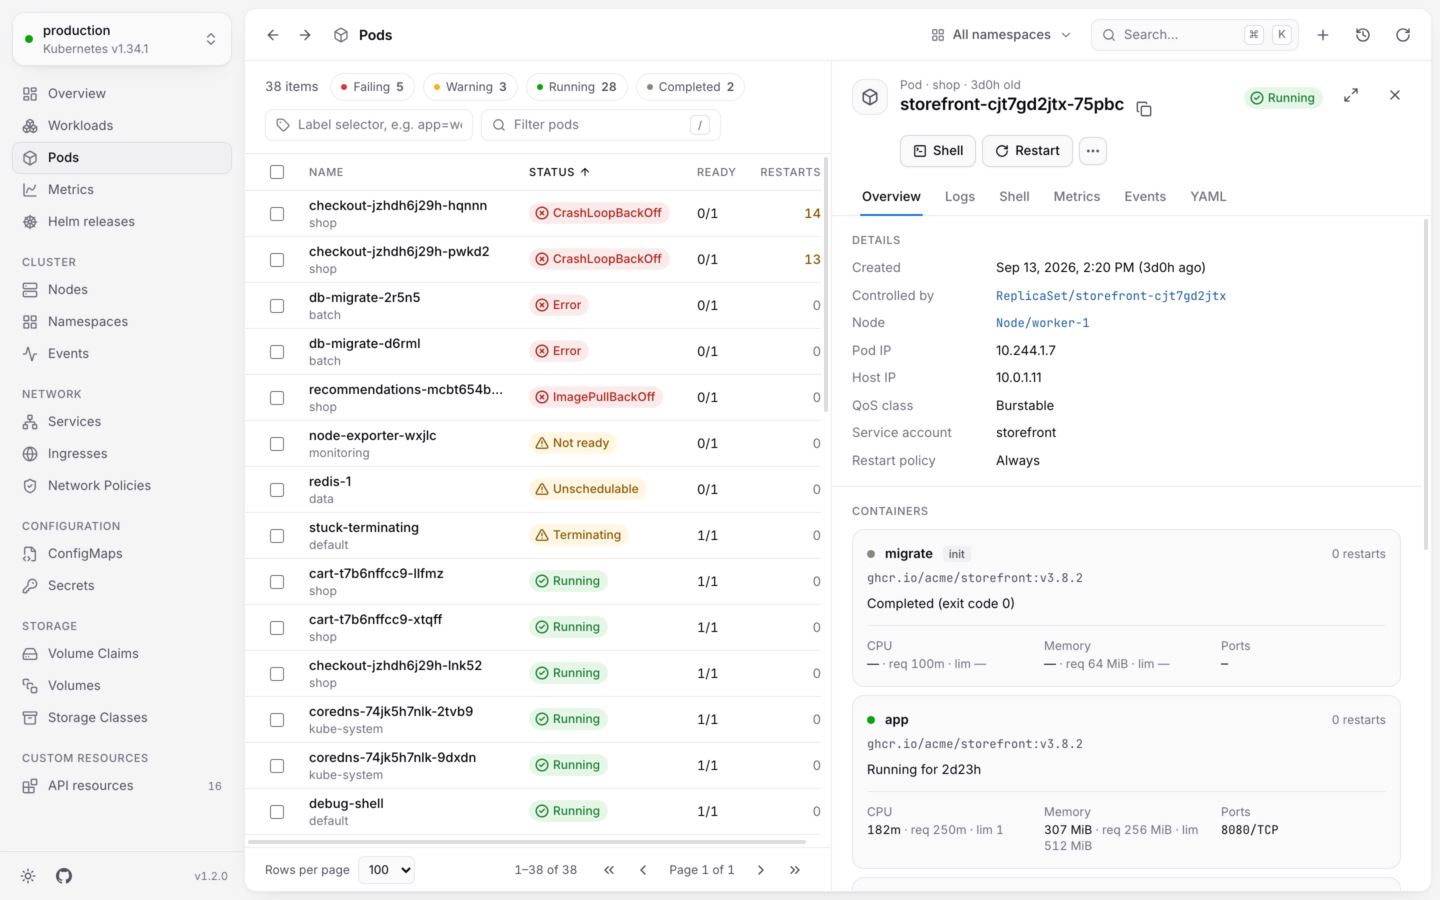
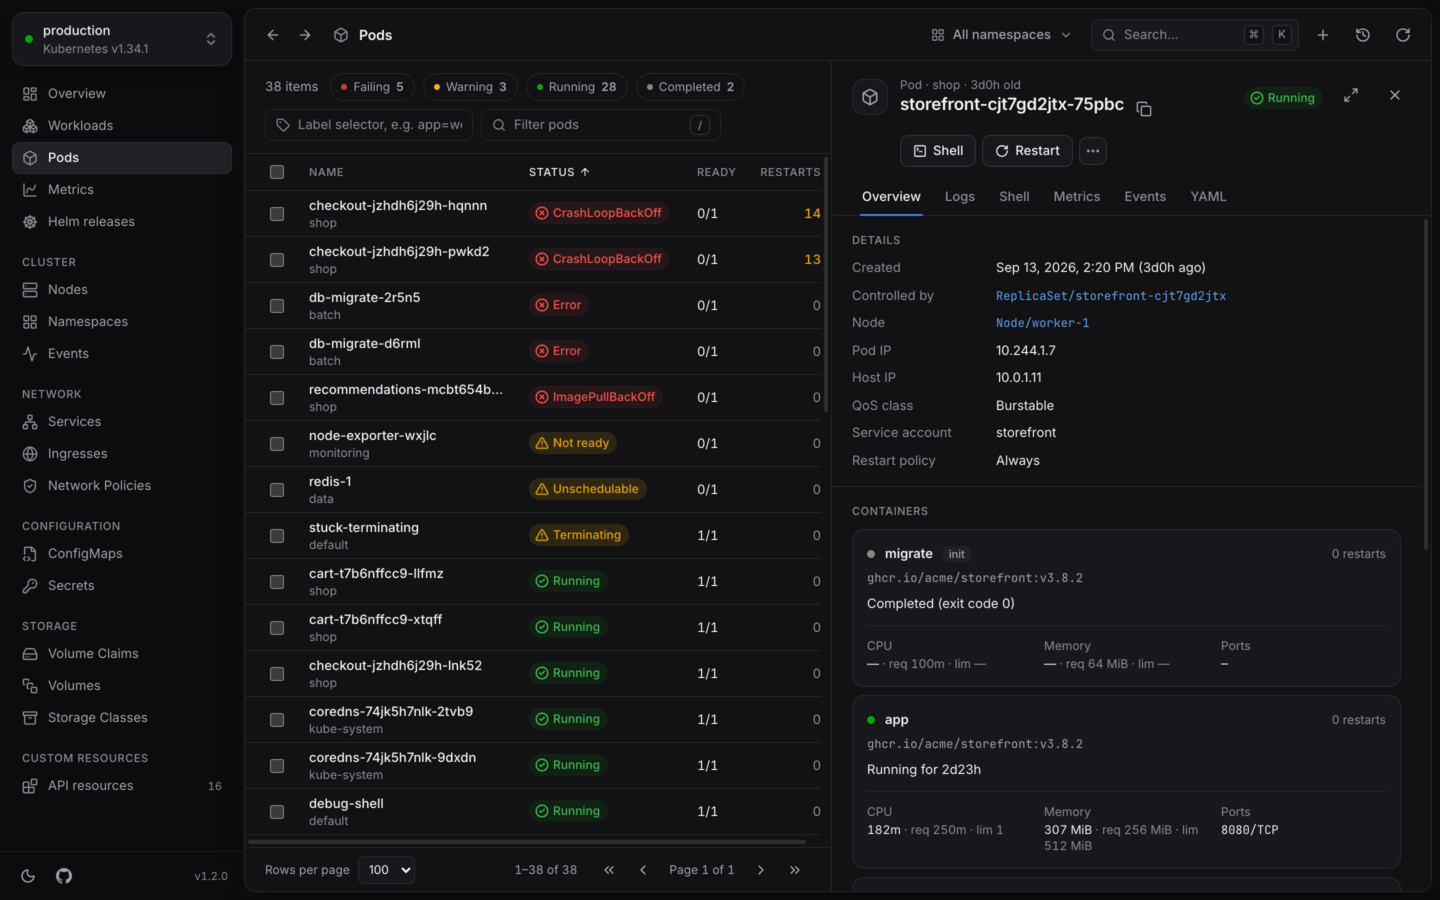 **Overview** starts with the facts: the node it runs on, its pod and host IPs, QoS class, service account, restart policy, and **Controlled by**, a link to the ReplicaSet, Job or other object that manages it.
Then a card for each container, init containers first:
* Its image and ports.
* Its state: *Running for 2h*, *Running for 5m, not ready*, the reason it's waiting (hover for the message), or how it ended, like *Error (exit code 1)*.
* How many times it restarted.
* Its CPU and memory use right now, next to its requests and limits.
* **Last terminated**, when it has restarted: the reason and exit code of its previous run. This is how an `OOMKilled` restart shows on a pod that's running again.
After the containers come the pod's conditions, labels and annotations.
### The other tabs
| Tab | What it's for |
| - | - |
| **Logs** | The pod's logs as they're written, with search and filters, and its previous run's. See [Logs](/debug/logs). |
| **Shell** | A terminal in any running container. See [Shells and debug containers](/debug/shell). |
| **Metrics** | Its CPU and memory over time, against requests and limits. See [Usage history](/metrics/usage-history). |
| **Events** | What happened to it, like failed image pulls and probe failures. |
| **YAML** | The whole object, to read, copy or edit. See [Edit YAML](/changes/yaml). |
## What you can do
From the panel, the **⋯** menu (.), the row's right-click menu or the command palette:
* **Shell** and **Debug…**, to look inside. A debug container works even in images with no shell.
* **Forward a port…**, to reach the pod from your computer. Desktop app
* **Restart**, for a pod something manages: it's deleted and its controller makes a new one.
* **Evict…**, through the Eviction API, so PodDisruptionBudgets are respected.
* **Delete…**, with **Force** for a pod stuck terminating.
Each one is described in [Actions by kind](/changes/actions). Right-click a pod for **Copy kubectl logs** too, alongside **Copy name** and **Copy kubectl describe**.
## Thousands of pods
Lists load in chunks of 500 and only draw the rows on screen, so a cluster with thousands of pods scrolls as smoothly as one with ten. Long lists refresh less often, and a list stops at 5,000 objects with a note saying so. Use a label selector to see the rest, or raise the limit with `KUBESTACKS_MAX_LIST_ITEMS`.
A pod's logs, or every pod of a workload, merged.
What each pod status means, and how it's worked out.
This documentation is built and hosted on [Mintlify](https://mintlify.com), a developer documentation platform.
**Overview** starts with the facts: the node it runs on, its pod and host IPs, QoS class, service account, restart policy, and **Controlled by**, a link to the ReplicaSet, Job or other object that manages it.
Then a card for each container, init containers first:
* Its image and ports.
* Its state: *Running for 2h*, *Running for 5m, not ready*, the reason it's waiting (hover for the message), or how it ended, like *Error (exit code 1)*.
* How many times it restarted.
* Its CPU and memory use right now, next to its requests and limits.
* **Last terminated**, when it has restarted: the reason and exit code of its previous run. This is how an `OOMKilled` restart shows on a pod that's running again.
After the containers come the pod's conditions, labels and annotations.
### The other tabs
| Tab | What it's for |
| - | - |
| **Logs** | The pod's logs as they're written, with search and filters, and its previous run's. See [Logs](/debug/logs). |
| **Shell** | A terminal in any running container. See [Shells and debug containers](/debug/shell). |
| **Metrics** | Its CPU and memory over time, against requests and limits. See [Usage history](/metrics/usage-history). |
| **Events** | What happened to it, like failed image pulls and probe failures. |
| **YAML** | The whole object, to read, copy or edit. See [Edit YAML](/changes/yaml). |
## What you can do
From the panel, the **⋯** menu (.), the row's right-click menu or the command palette:
* **Shell** and **Debug…**, to look inside. A debug container works even in images with no shell.
* **Forward a port…**, to reach the pod from your computer. Desktop app
* **Restart**, for a pod something manages: it's deleted and its controller makes a new one.
* **Evict…**, through the Eviction API, so PodDisruptionBudgets are respected.
* **Delete…**, with **Force** for a pod stuck terminating.
Each one is described in [Actions by kind](/changes/actions). Right-click a pod for **Copy kubectl logs** too, alongside **Copy name** and **Copy kubectl describe**.
## Thousands of pods
Lists load in chunks of 500 and only draw the rows on screen, so a cluster with thousands of pods scrolls as smoothly as one with ten. Long lists refresh less often, and a list stops at 5,000 objects with a note saying so. Use a label selector to see the rest, or raise the limit with `KUBESTACKS_MAX_LIST_ITEMS`.
A pod's logs, or every pod of a workload, merged.
What each pod status means, and how it's worked out.
This documentation is built and hosted on [Mintlify](https://mintlify.com), a developer documentation platform.