> ## Documentation Index
> Fetch the complete documentation index at: https://docs.kubestacks.com/llms.txt
> Use this file to discover all available pages before exploring further.
# A quick tour
> Five minutes through the ideas KubeStacks is built on: problems first, details next to the list, and every change shown before it's made.
This tour follows what you'd do on a day something breaks: see what's wrong, find it, look closer, and fix it. Keyboard shortcuts are shown for macOS; on Windows and Linux, use Ctrl for ⌘.
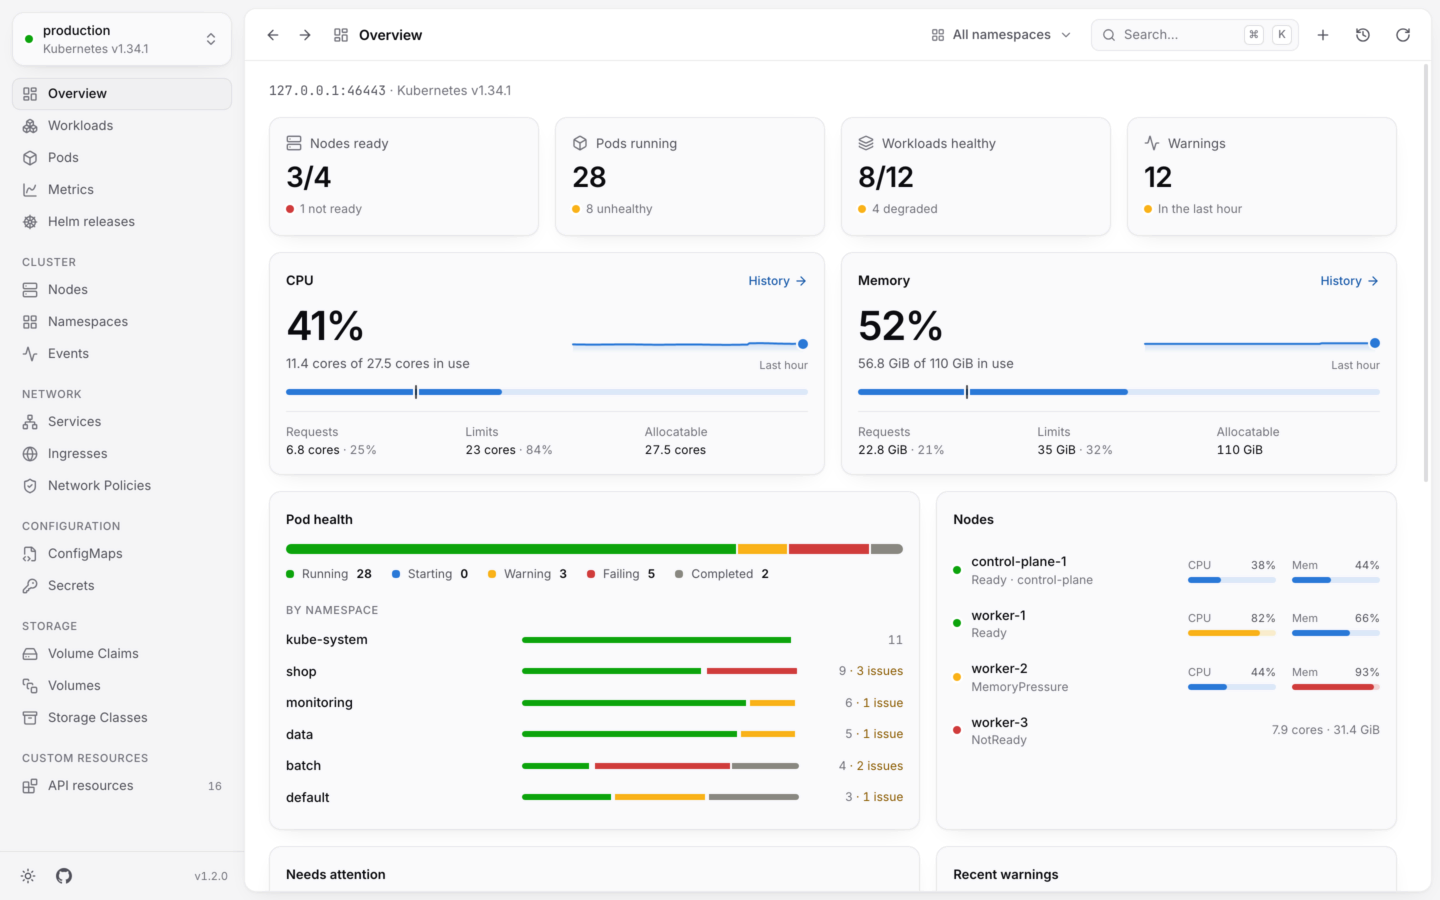
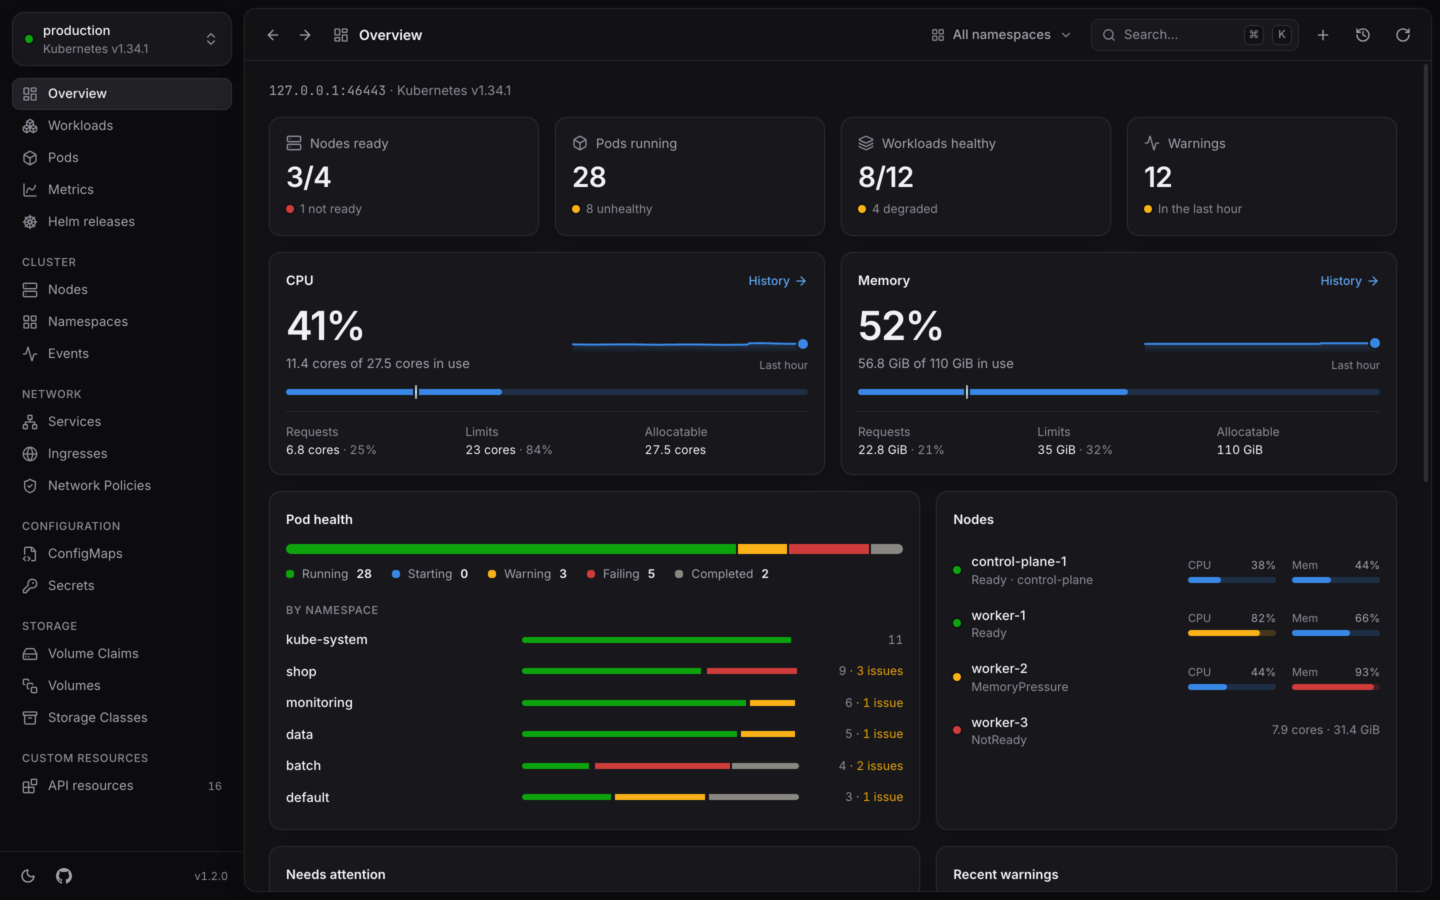
Every cluster opens on its **Overview**. Four tiles say how many nodes are ready, how many pods are running, how many workloads are healthy, and how many warnings came in the last hour. Each tile links to its list, filtered to what's wrong when something is.
Below them, CPU and memory show what's in use next to what's requested, limited and allocatable, with a line of recent usage. **Needs attention** lists the pods and workloads in trouble, and **Recent warnings** the events that explain them.
 The namespace menu at the top scopes every list. It starts in your kubeconfig context's namespace, and remembers your choice per cluster. [More about the overview](/explore/overview).
Open **Workloads** (G then W). Every Deployment, StatefulSet, DaemonSet, Job and CronJob is in one list, with its status, ready pods and the CPU and memory its pods use. Whatever is failing sorts to the top, whatever its kind.
The namespace menu at the top scopes every list. It starts in your kubeconfig context's namespace, and remembers your choice per cluster. [More about the overview](/explore/overview).
Open **Workloads** (G then W). Every Deployment, StatefulSet, DaemonSet, Job and CronJob is in one list, with its status, ready pods and the CPU and memory its pods use. Whatever is failing sorts to the top, whatever its kind.
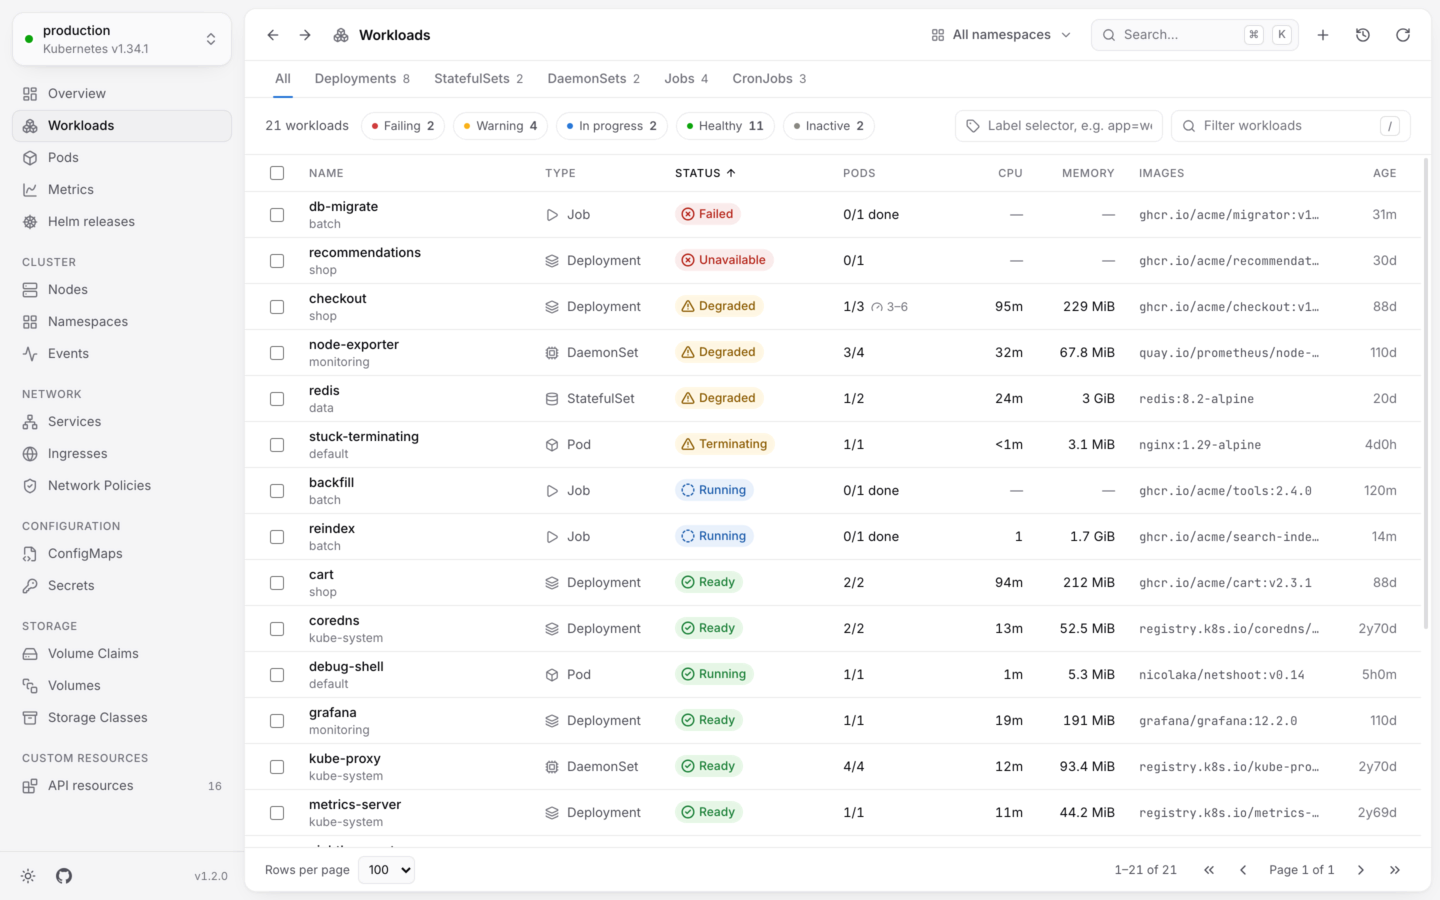
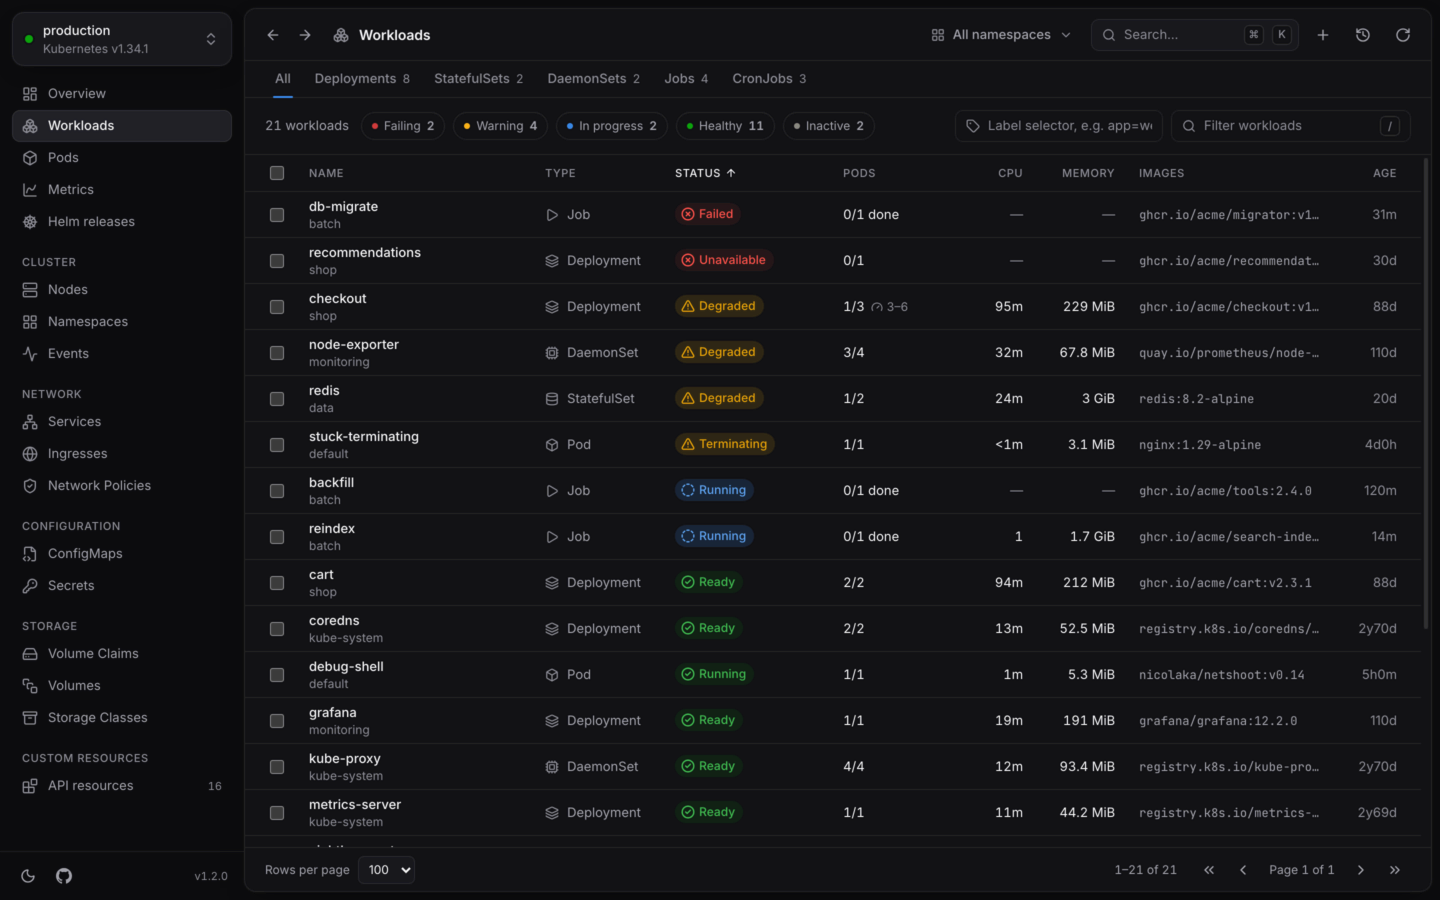 Statuses read the way you'd say them: Unavailable Degraded Running Ready. The chips above the list keep only what's **Failing**, **Warning**, **In progress**, **Healthy** or **Inactive**. [How health works](/explore/health).
Click a row, or move to it with ↓ and press ↵. Its details open next to the list, so you keep your place: the facts that matter for its kind, its pods and why they restart, its events, logs and YAML.
Statuses read the way you'd say them: Unavailable Degraded Running Ready. The chips above the list keep only what's **Failing**, **Warning**, **In progress**, **Healthy** or **Inactive**. [How health works](/explore/health).
Click a row, or move to it with ↓ and press ↵. Its details open next to the list, so you keep your place: the facts that matter for its kind, its pods and why they restart, its events, logs and YAML.
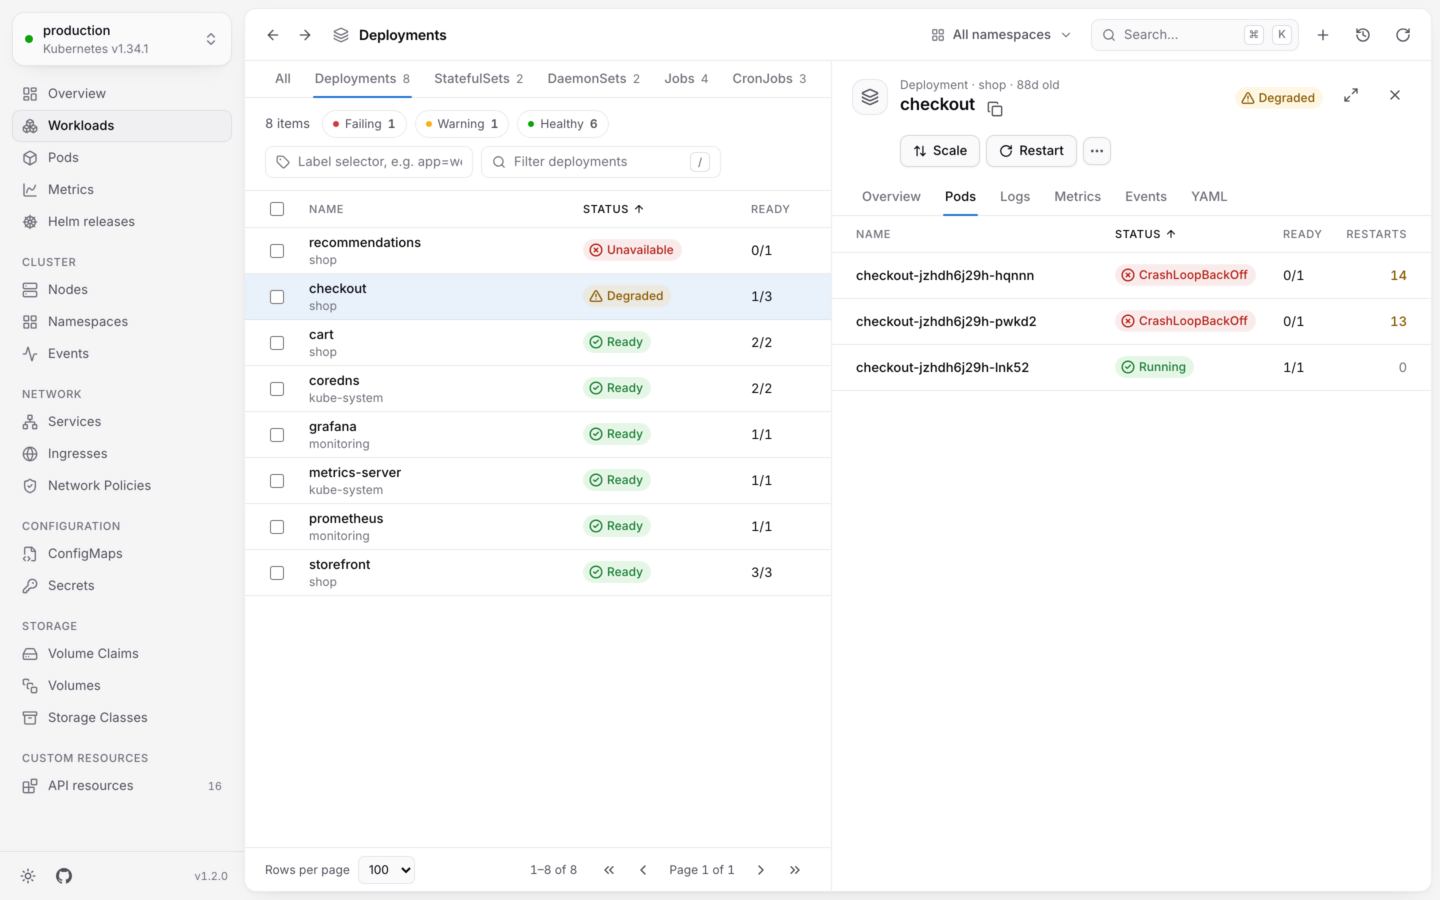
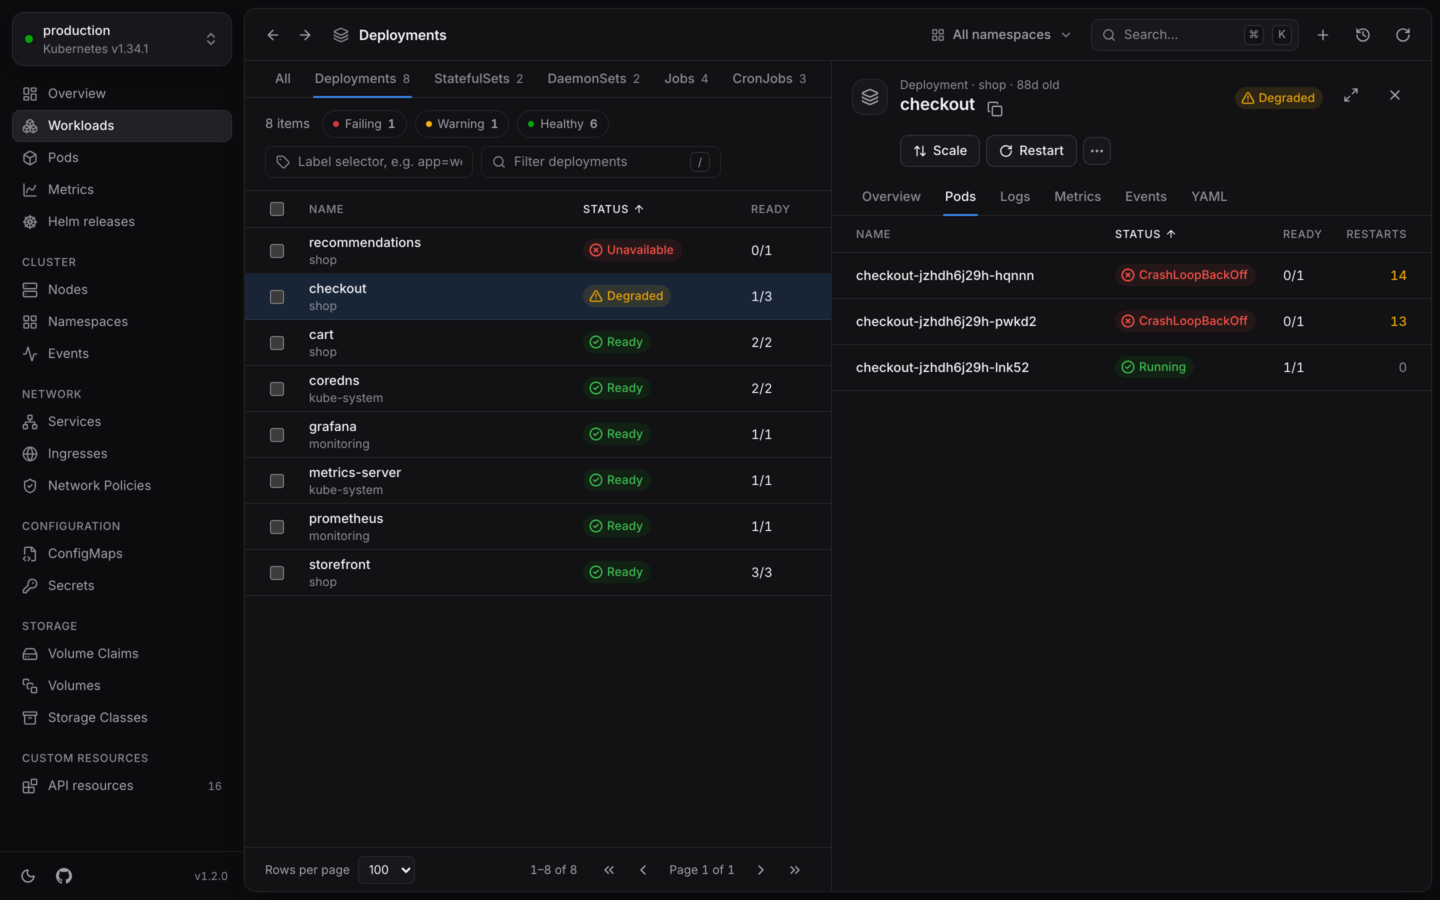 With the panel open, ↑ and ↓ open each row in turn, and Esc closes it. [The detail panel](/explore/details).
The **Logs** tab of a workload merges every one of its pods, in the order lines were written, each marked with its pod. Pods that start later join in. Keep only errors or warnings, leave a pod out, or search.
With the panel open, ↑ and ↓ open each row in turn, and Esc closes it. [The detail panel](/explore/details).
The **Logs** tab of a workload merges every one of its pods, in the order lines were written, each marked with its pod. Pods that start later join in. Keep only errors or warnings, leave a pod out, or search.
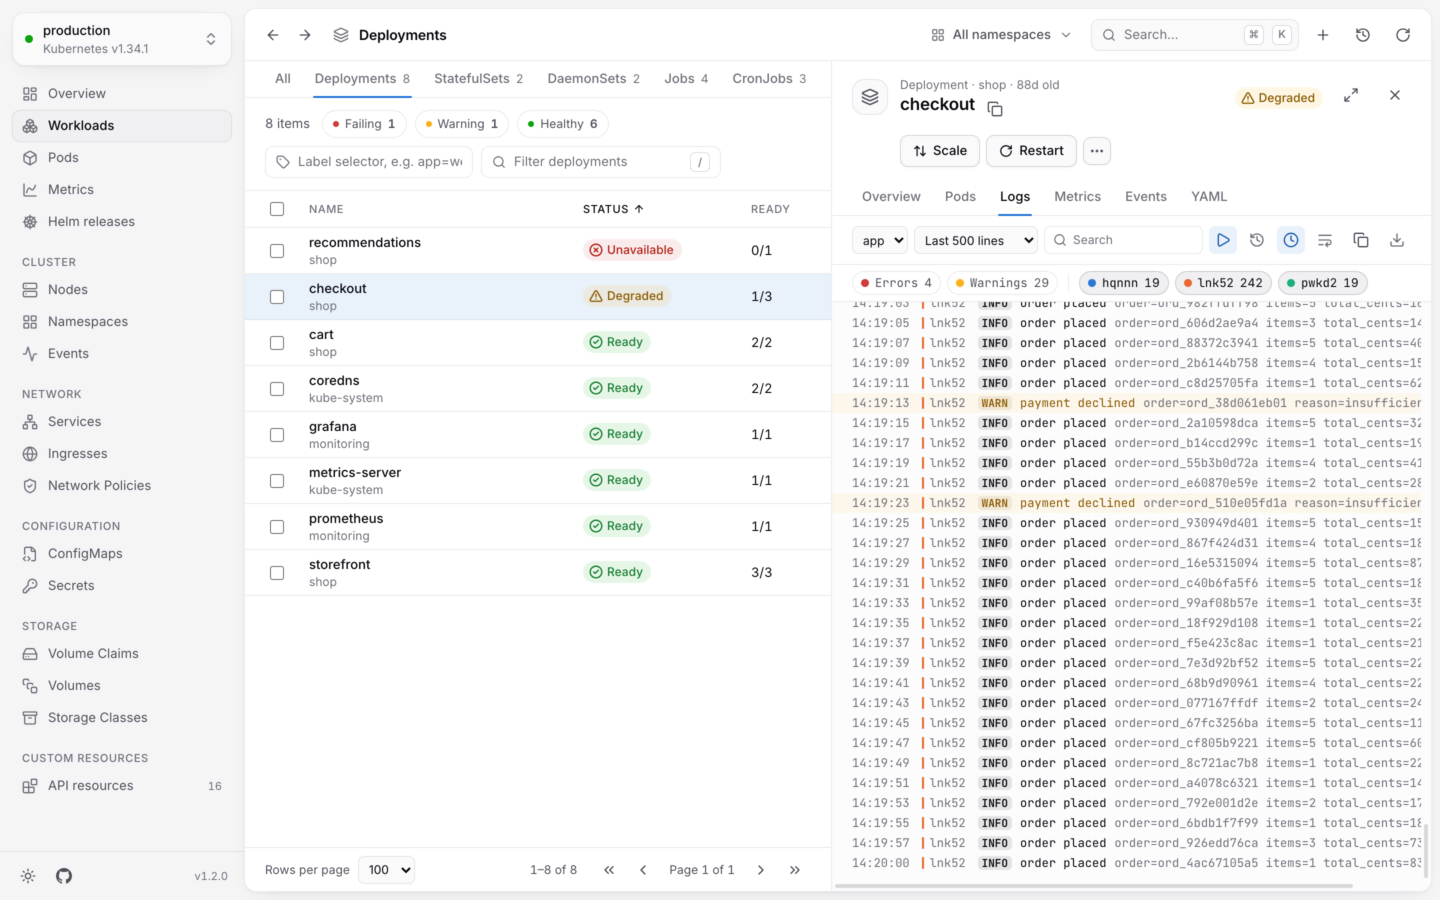
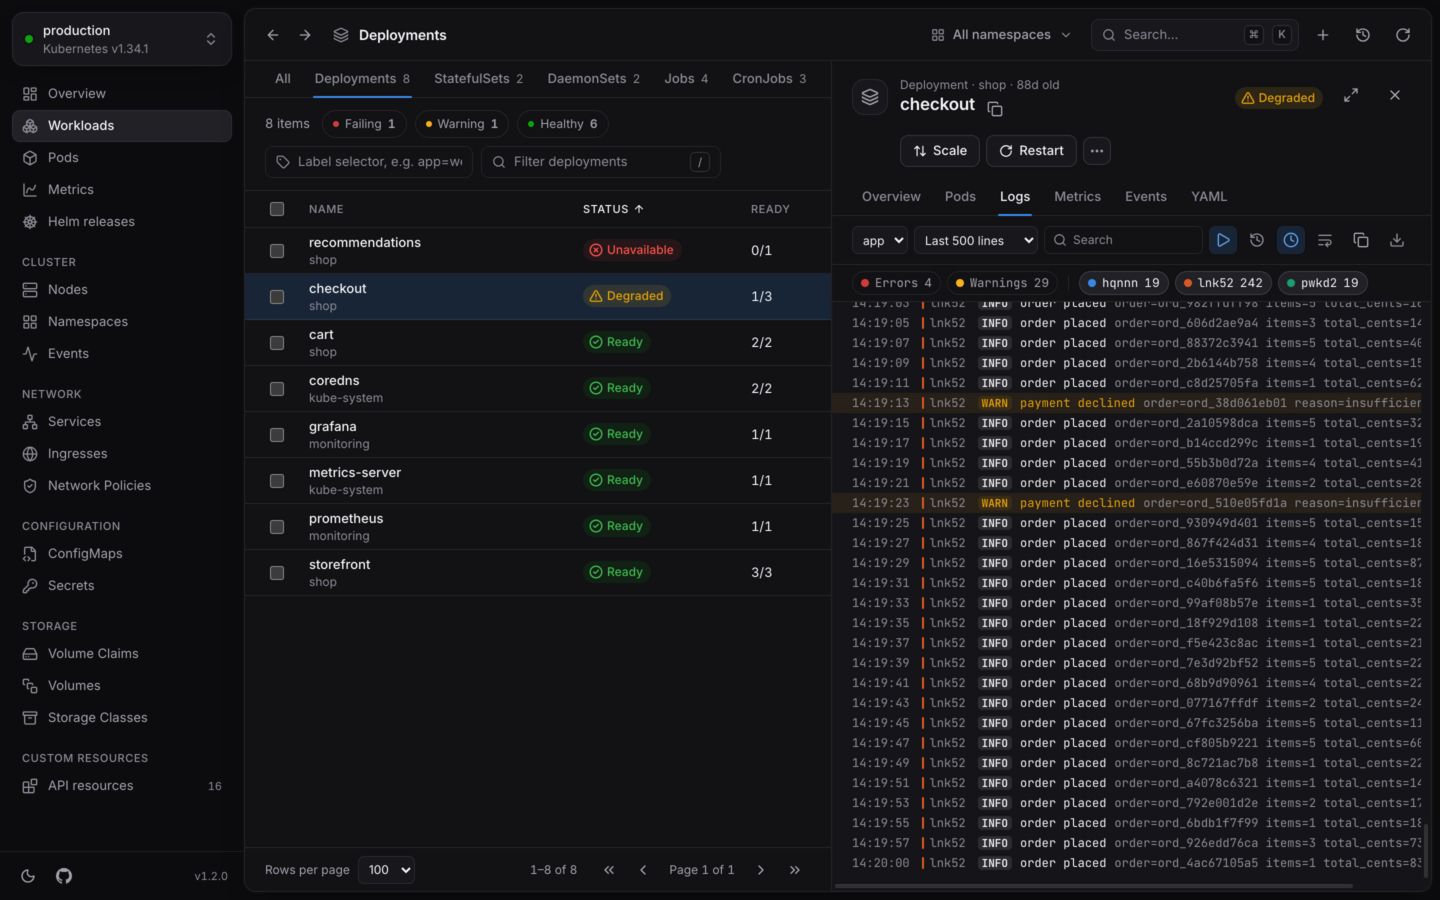 A pod also has a **Shell** tab, for a terminal in its containers. [Logs](/debug/logs) · [Shells and debug containers](/debug/shell).
The open object's actions are right there: the common ones as buttons, the rest under **⋯** (or .). Every dialog names the cluster and shows the `kubectl` command it amounts to. KubeStacks checks your permissions first, and disables what you can't do, saying why.
A pod also has a **Shell** tab, for a terminal in its containers. [Logs](/debug/logs) · [Shells and debug containers](/debug/shell).
The open object's actions are right there: the common ones as buttons, the rest under **⋯** (or .). Every dialog names the cluster and shows the `kubectl` command it amounts to. KubeStacks checks your permissions first, and disables what you can't do, saying why.
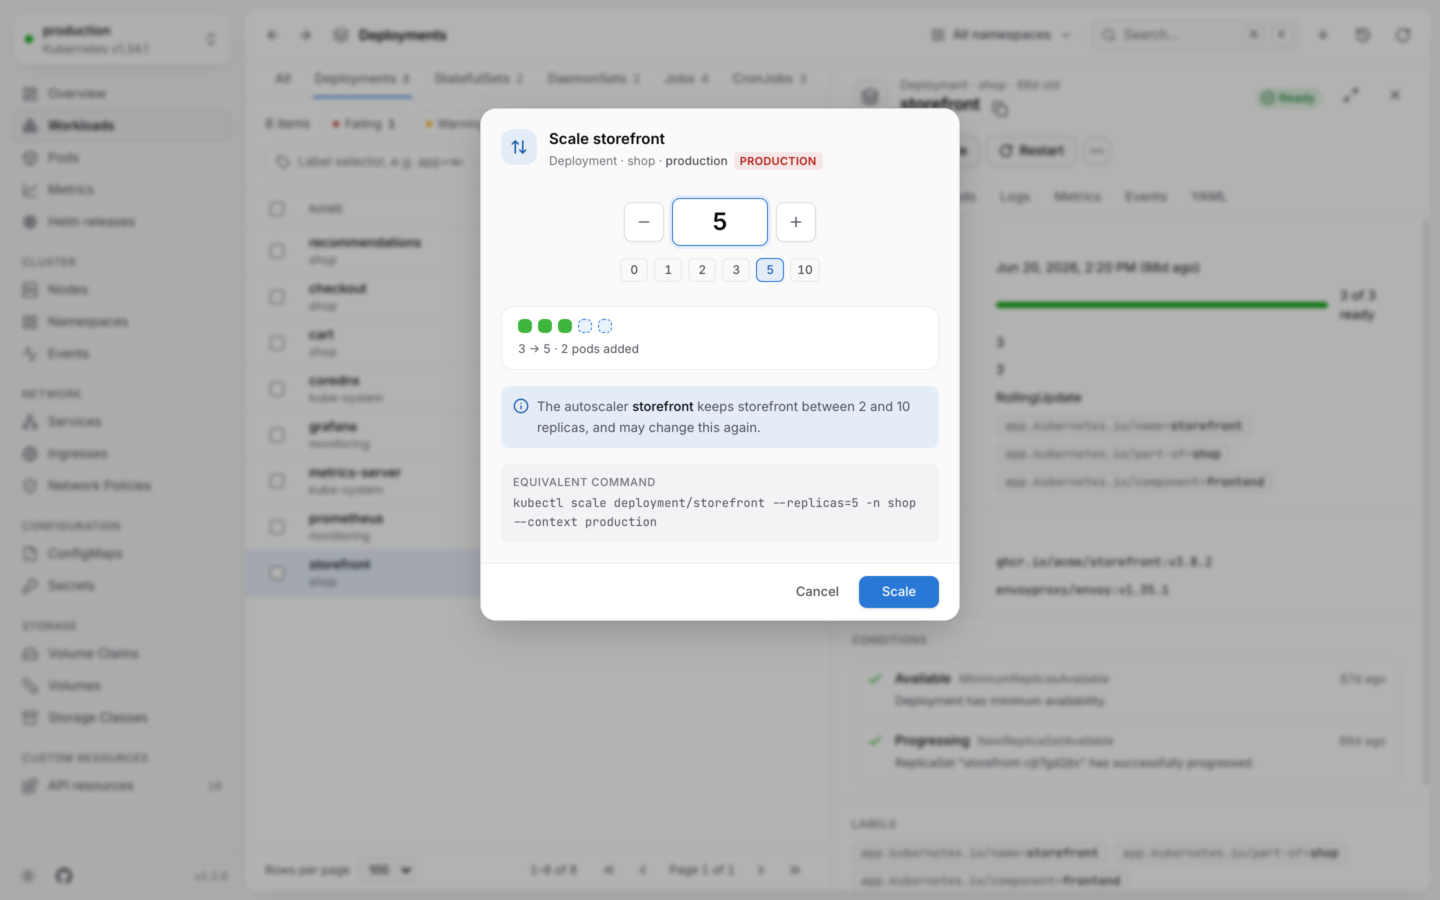
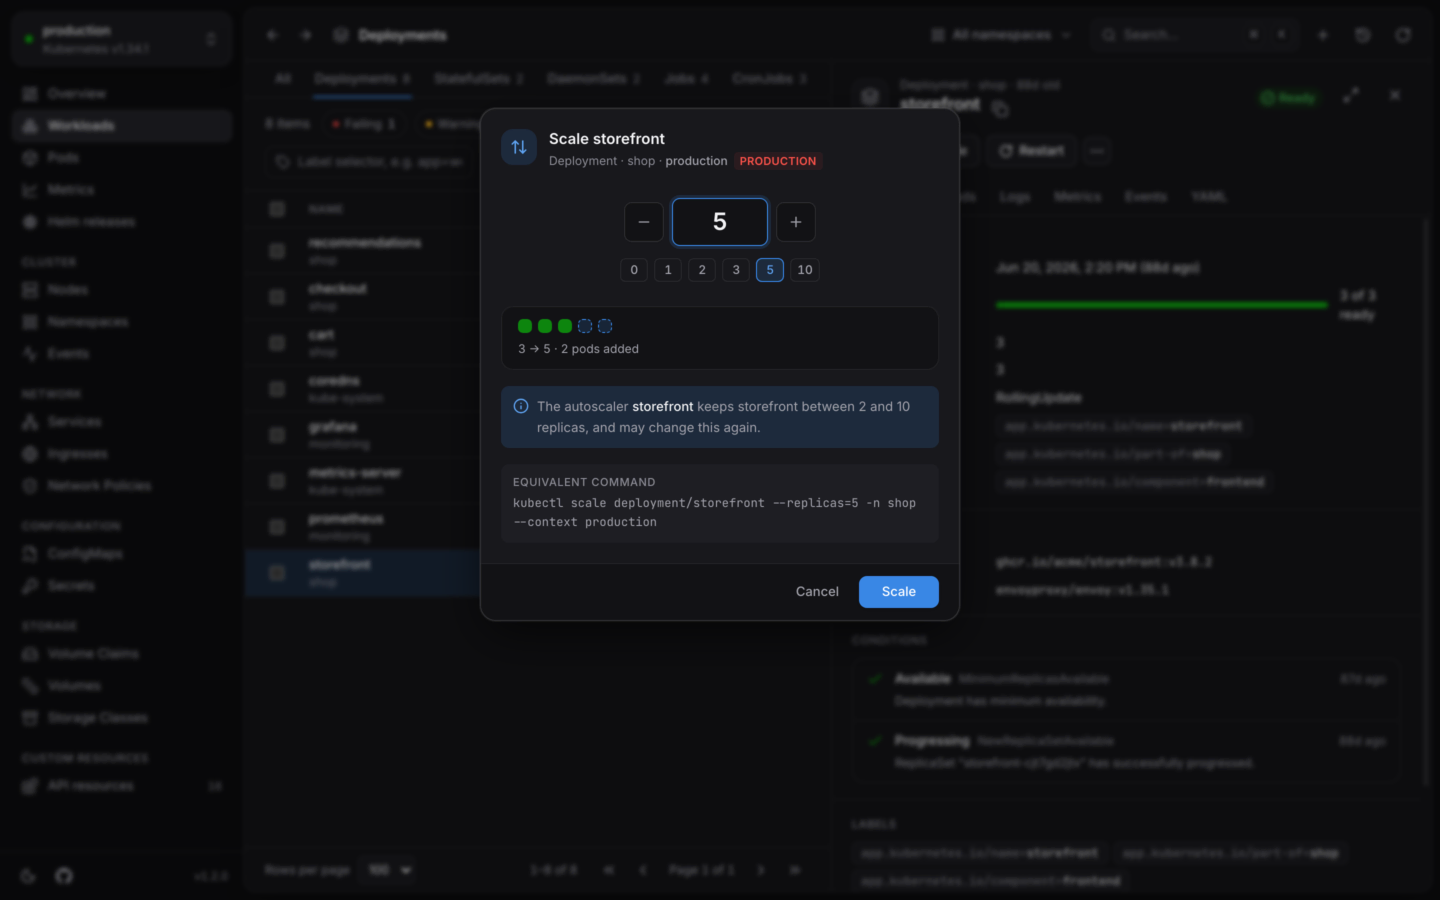 Once it's done, the notification offers **Undo** for changes that can be taken back, like a scale. [Changing things safely](/changes/safely).
Press ⌘K. Type a few letters to jump to any view, any object already loaded, a namespace or another cluster, or to run an action on the object you have open.
Once it's done, the notification offers **Undo** for changes that can be taken back, like a scale. [Changing things safely](/changes/safely).
Press ⌘K. Type a few letters to jump to any view, any object already loaded, a namespace or another cluster, or to run an action on the object you have open.
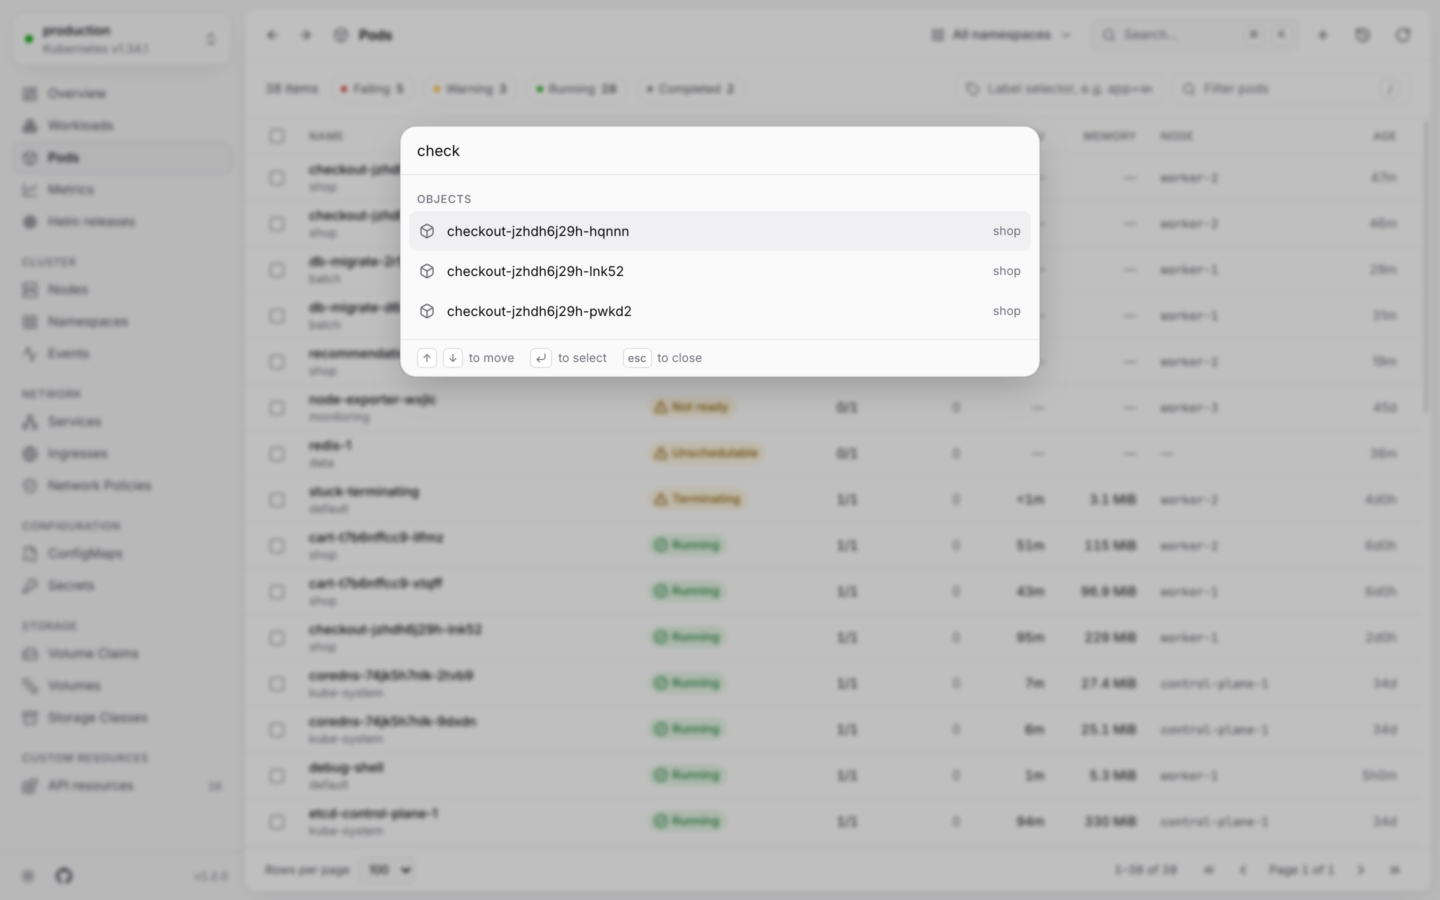
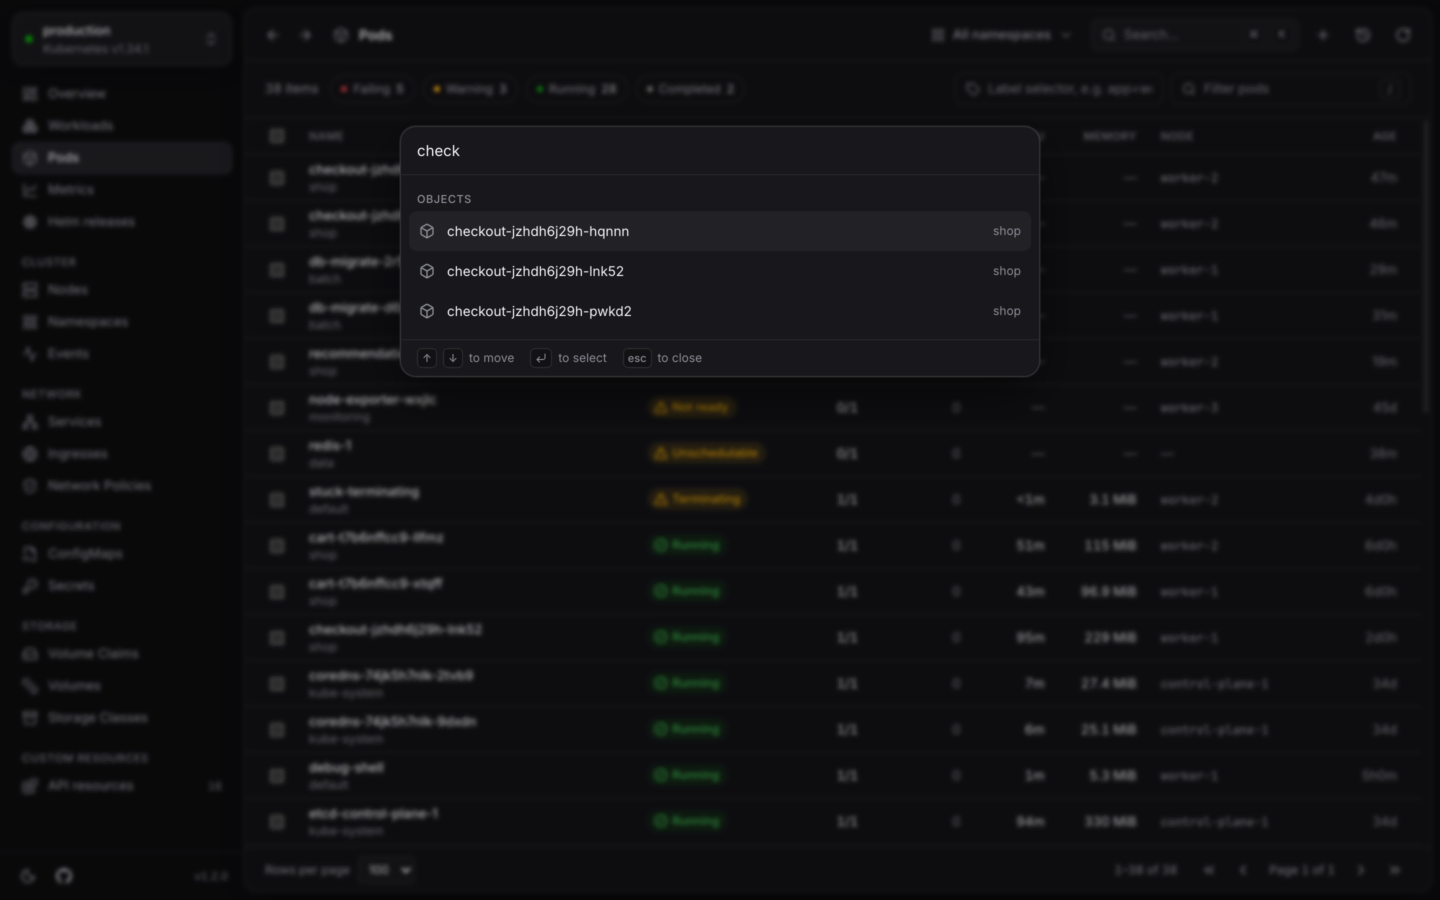 Most views also have a G shortcut, shown when you hover them in the sidebar, and ? lists them all. [Keyboard shortcuts](/reference/keyboard-shortcuts).
## Where to next
Chart what namespaces, workloads and nodes use, from your Prometheus.
Every release, its values and revisions, and upgrades reviewed first.
Certificates, Argo CD apps, Flux kustomizations and every other kind.
Look around a production cluster with changes turned off.
This documentation is built and hosted on [Mintlify](https://mintlify.com), a developer documentation platform.
Most views also have a G shortcut, shown when you hover them in the sidebar, and ? lists them all. [Keyboard shortcuts](/reference/keyboard-shortcuts).
## Where to next
Chart what namespaces, workloads and nodes use, from your Prometheus.
Every release, its values and revisions, and upgrades reviewed first.
Certificates, Argo CD apps, Flux kustomizations and every other kind.
Look around a production cluster with changes turned off.
This documentation is built and hosted on [Mintlify](https://mintlify.com), a developer documentation platform.