> ## Documentation Index
> Fetch the complete documentation index at: https://docs.kubestacks.com/llms.txt
> Use this file to discover all available pages before exploring further.
# Live usage
> CPU and memory as they are right now, from metrics-server, set against requests, limits and what your nodes can give.
Live usage comes from the Kubernetes metrics API, the same place `kubectl top` reads from. It's served by [metrics-server](https://github.com/kubernetes-sigs/metrics-server), which most managed clusters run already. KubeStacks asks for it every 5 seconds while it's open, and needs nothing else installed.
 ## Where you see it
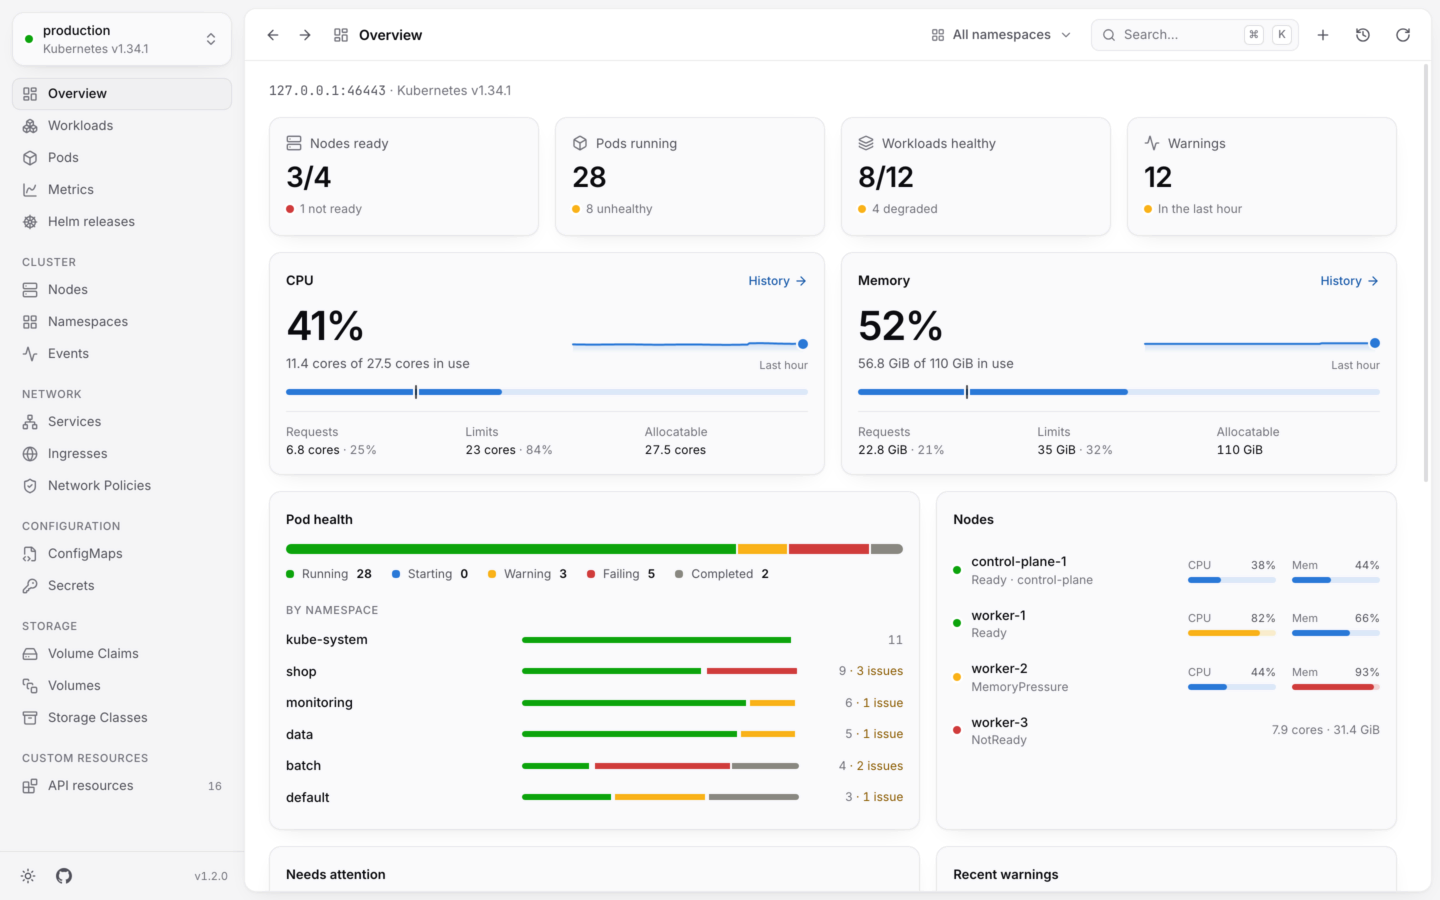
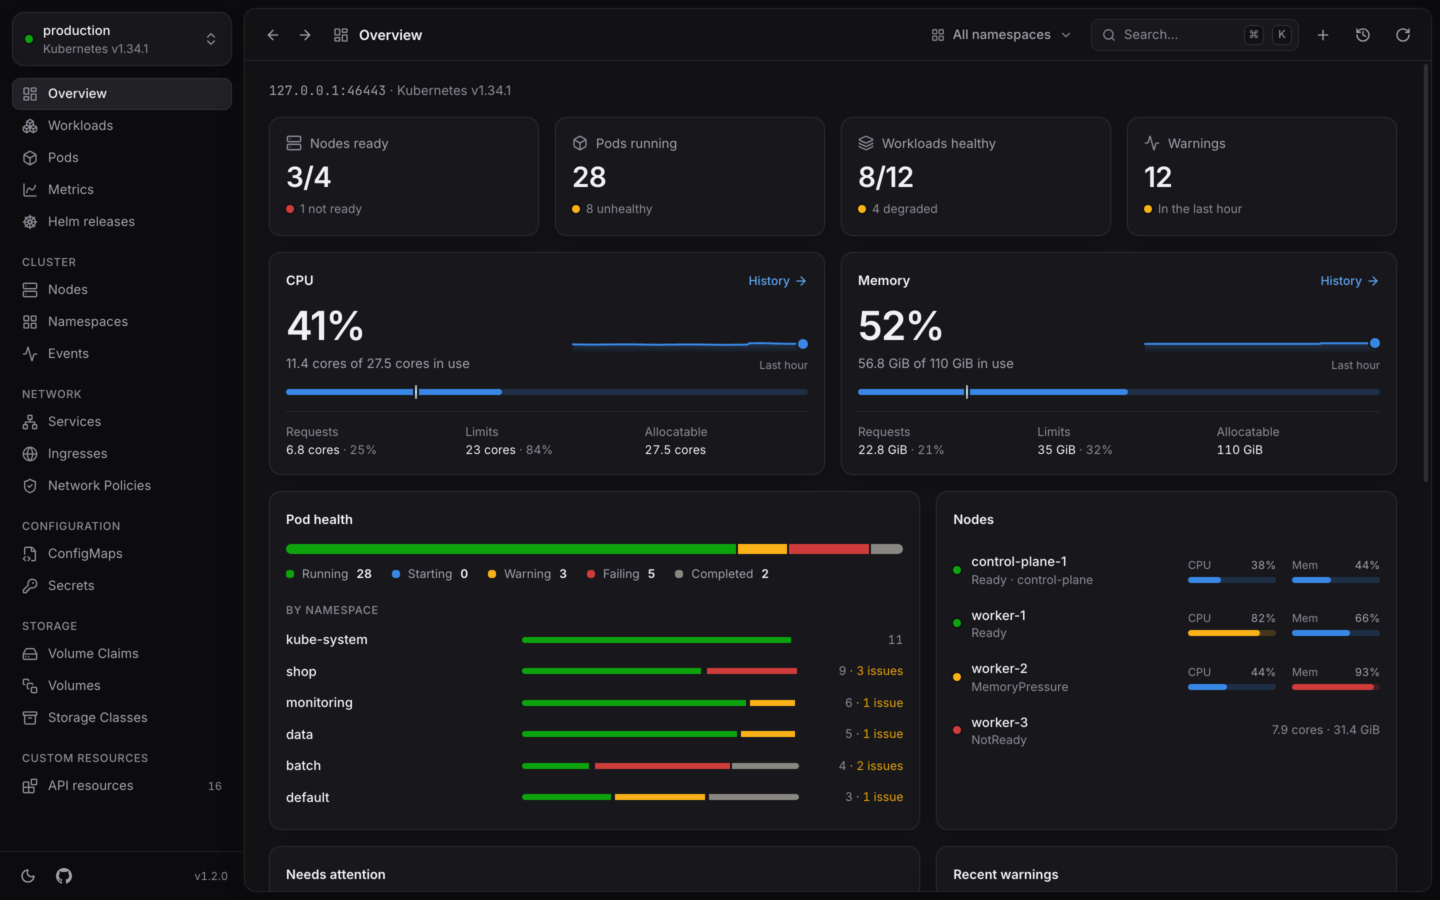
Each card leads with how much of the cluster is in use, as a percentage and as "12.2 cores of 27.5 cores in use". The meter below it marks where requests reach, and the row underneath lists:
| | |
| - | - |
| **Requests** | What running pods ask for, added up, and its share of allocatable |
| **Limits** | What they're allowed to use, added up, and its share |
| **Allocatable** | What the scheduler can hand out across every node |
Pods that have finished (Succeeded or Failed) don't count, since they no longer hold anything.
The small chart beside the number is a trend. With [usage history](/metrics/usage-history), it covers the last hour, and **History →** opens the Metrics page. Without it, it covers the time **Since you opened it**.
The overview's **Nodes** card has a CPU and a memory meter for each node, against what that node can allocate. **Top CPU** and **Top memory** list the five pods using the most.
The **Nodes** list has the same meters in its **CPU** and **Memory** columns, and you can sort by them.
The **Pods** list has **CPU** and **Memory** columns, sortable, so the hungriest pods are a click away. In **Workloads**, each workload's usage is added up over its pods. A pod's detail panel shows each container's usage next to its state.
## Without metrics-server
Everything else keeps working. Where usage would be, KubeStacks shows what it can work out from the cluster itself:
* The overview's cards show what's **requested** instead of what's used ("6.8 cores of 27.5 cores requested"), with the note **Live usage needs metrics-server**.
* The **Nodes** list shows each node's allocatable CPU and memory instead of a meter.
* Pods' **CPU** and **Memory** columns stay empty, and **Top CPU** and **Top memory** don't appear.
A node that reports nothing while metrics-server runs (one that's NotReady, say) shows **No metrics**.
## Install metrics-server
If your cluster doesn't have it, metrics-server's own chart or manifest installs it in a minute. It goes in `kube-system`.
```bash theme={"theme":{"light":"github-light","dark":"github-dark-default"}}
helm upgrade --install metrics-server metrics-server \
--repo https://kubernetes-sigs.github.io/metrics-server/ \
--namespace kube-system
```
```bash theme={"theme":{"light":"github-light","dark":"github-dark-default"}}
kubectl apply -f https://github.com/kubernetes-sigs/metrics-server/releases/latest/download/components.yaml
```
On a local cluster like [kind](https://kind.sigs.k8s.io), kubelets serve self-signed certificates, and metrics-server needs `--kubelet-insecure-tls` to read them. With the chart, pass `--set 'args={--kubelet-insecure-tls}'`. Don't use it in clusters that matter.
Usage shows up in KubeStacks within a minute or so, once metrics-server has its first samples. You don't need to restart anything.
## Live usage and history
Live usage is a snapshot, a few seconds old. To see how usage changed over the last hour, day or week, and compare namespaces, workloads, pods or nodes, KubeStacks charts history from a Prometheus or VictoriaMetrics in the cluster.
The Metrics page, and a Metrics tab on pods, workloads and nodes.
Everything else on a cluster's first page.
This documentation is built and hosted on [Mintlify](https://mintlify.com), a developer documentation platform.
## Where you see it
Each card leads with how much of the cluster is in use, as a percentage and as "12.2 cores of 27.5 cores in use". The meter below it marks where requests reach, and the row underneath lists:
| | |
| - | - |
| **Requests** | What running pods ask for, added up, and its share of allocatable |
| **Limits** | What they're allowed to use, added up, and its share |
| **Allocatable** | What the scheduler can hand out across every node |
Pods that have finished (Succeeded or Failed) don't count, since they no longer hold anything.
The small chart beside the number is a trend. With [usage history](/metrics/usage-history), it covers the last hour, and **History →** opens the Metrics page. Without it, it covers the time **Since you opened it**.
The overview's **Nodes** card has a CPU and a memory meter for each node, against what that node can allocate. **Top CPU** and **Top memory** list the five pods using the most.
The **Nodes** list has the same meters in its **CPU** and **Memory** columns, and you can sort by them.
The **Pods** list has **CPU** and **Memory** columns, sortable, so the hungriest pods are a click away. In **Workloads**, each workload's usage is added up over its pods. A pod's detail panel shows each container's usage next to its state.
## Without metrics-server
Everything else keeps working. Where usage would be, KubeStacks shows what it can work out from the cluster itself:
* The overview's cards show what's **requested** instead of what's used ("6.8 cores of 27.5 cores requested"), with the note **Live usage needs metrics-server**.
* The **Nodes** list shows each node's allocatable CPU and memory instead of a meter.
* Pods' **CPU** and **Memory** columns stay empty, and **Top CPU** and **Top memory** don't appear.
A node that reports nothing while metrics-server runs (one that's NotReady, say) shows **No metrics**.
## Install metrics-server
If your cluster doesn't have it, metrics-server's own chart or manifest installs it in a minute. It goes in `kube-system`.
```bash theme={"theme":{"light":"github-light","dark":"github-dark-default"}}
helm upgrade --install metrics-server metrics-server \
--repo https://kubernetes-sigs.github.io/metrics-server/ \
--namespace kube-system
```
```bash theme={"theme":{"light":"github-light","dark":"github-dark-default"}}
kubectl apply -f https://github.com/kubernetes-sigs/metrics-server/releases/latest/download/components.yaml
```
On a local cluster like [kind](https://kind.sigs.k8s.io), kubelets serve self-signed certificates, and metrics-server needs `--kubelet-insecure-tls` to read them. With the chart, pass `--set 'args={--kubelet-insecure-tls}'`. Don't use it in clusters that matter.
Usage shows up in KubeStacks within a minute or so, once metrics-server has its first samples. You don't need to restart anything.
## Live usage and history
Live usage is a snapshot, a few seconds old. To see how usage changed over the last hour, day or week, and compare namespaces, workloads, pods or nodes, KubeStacks charts history from a Prometheus or VictoriaMetrics in the cluster.
The Metrics page, and a Metrics tab on pods, workloads and nodes.
Everything else on a cluster's first page.
This documentation is built and hosted on [Mintlify](https://mintlify.com), a developer documentation platform.