> ## Documentation Index
> Fetch the complete documentation index at: https://docs.kubestacks.com/llms.txt
> Use this file to discover all available pages before exploring further.
# Usage history
> Chart what the cluster used over the last 15 minutes to the last week, from the Prometheus or VictoriaMetrics you already run.
KubeStacks finds the Prometheus or VictoriaMetrics in your cluster and charts what the cluster used, from the last 15 minutes to the last week. It asks through the API server with your own credentials, so nothing needs to be port-forwarded or exposed.
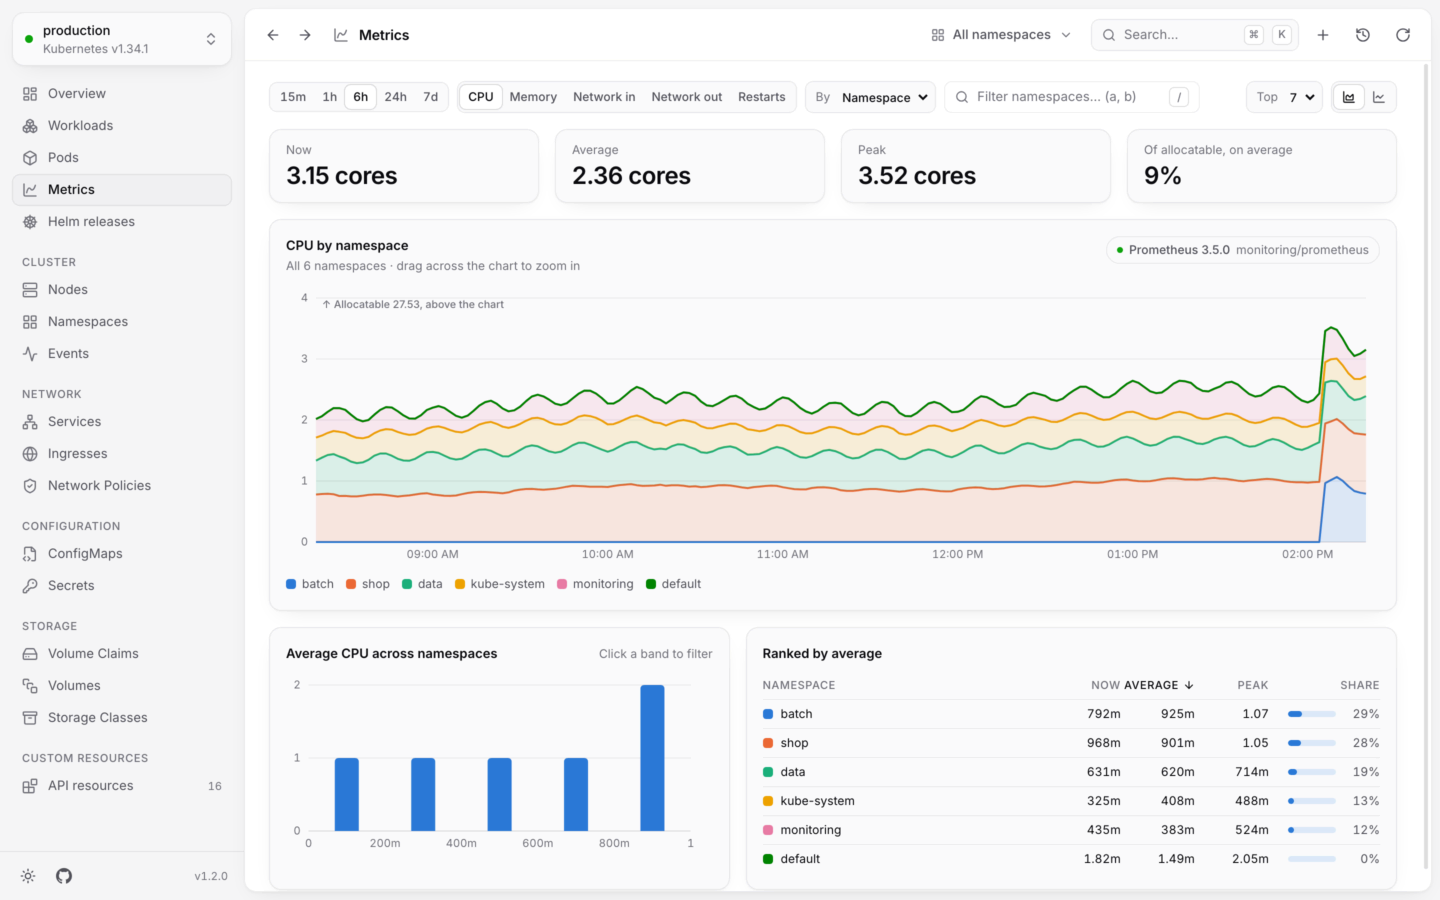
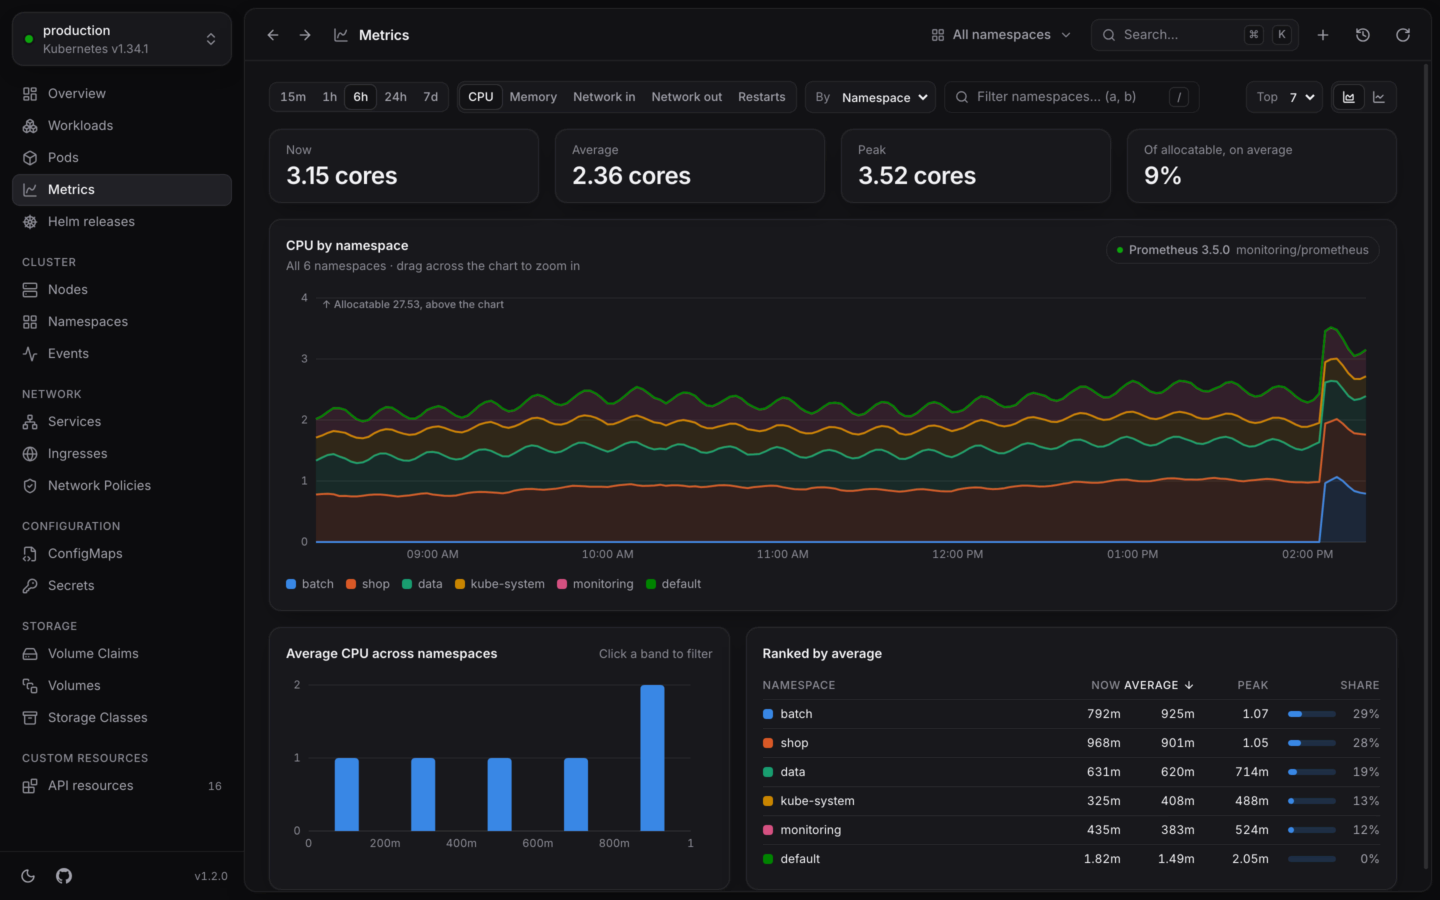
History shows up in two places: the **Metrics** page, which ranks and compares, and a **Metrics** tab on pods, workloads and nodes.
 ## What you need
* **A Prometheus-compatible server in the cluster.** Prometheus (as kube-prometheus-stack, the Prometheus chart or kube-prometheus install it) or VictoriaMetrics, single-node or cluster.
* **cAdvisor's metrics, scraped.** CPU, memory and network charts use the kubelet's `container_*` series. kube-prometheus-stack scrapes them out of the box.
* **kube-state-metrics**, for restarts. It also places pods on nodes when cAdvisor's series don't carry a `node` label.
* **Permission to reach it.** Your account needs `get` on `services/proxy` in the namespace the server runs in, and `list` on services to find it.
## How KubeStacks finds it
You usually don't have to do anything. Unless you've chosen a source, KubeStacks looks through the cluster's services for one that answers PromQL:
It skips services that come with Prometheus but don't answer queries themselves (Alertmanager, operators, exporters, kube-state-metrics, Grafana, VictoriaMetrics' agent and storage components, and so on), and rates the rest by their name and their `app.kubernetes.io/name` or `app` label:
| Score | Looks like | Port it uses |
| - | - | - |
| 90 | The Prometheus operator's service (`operated-prometheus: "true"`), or one named `prometheus`, `prometheus-operated`, `prometheus-server`, `prometheus-k8s` or `…-prometheus` | One named `web`, `http-web` or `http`, else 9090 or 80 |
| 85 | VictoriaMetrics single-node (`vmsingle`, `victoria-metrics`) | One named `http`, else 8429 or 8428 |
| 80 | VictoriaMetrics' `vmselect` | One named `http`, else 8481, with the path `/select/0/prometheus` |
| 60 | Anything else with Prometheus in its name or labels | As for 90 |
Services in a namespace named `monitoring`, `prometheus`, `observability` or `victoria-metrics` get 5 more.
In order, it sends each a trivial query. The first that answers is used. Its name and version show on the chip at the top of every chart.
If yours runs under a name KubeStacks doesn't recognize, or you have several and want another, choose it yourself.
## Choosing the source
Open **Metrics source** from the chip on any chart, or from the command palette (⌘K, then "Metrics source"). ⌘ is Ctrl on Windows and Linux.
The default. KubeStacks looks for Prometheus and VictoriaMetrics among the cluster's services, as described above.
A Prometheus-compatible service in the cluster, reached through the API server. Pick its **Namespace**, **Service** and **Port**, and a **Path** if it serves PromQL below the root:
| Server | Path |
| - | - |
| Prometheus, VictoriaMetrics single-node | Leave it empty |
| VictoriaMetrics `vmselect` | `/select/0/prometheus` |
**Test** asks it right away, and says what answered and its version. **Save** tests it again, and saves only if it answers. If KubeStacks can't list namespaces or services, the fields become text you type.
Live usage only, from the metrics API. Charts are replaced by a note saying history is off.
The choice is kept per cluster.
**In your cluster:** the administrator sets the default for everyone with the chart's `metrics.source` (`auto`, `off`, or a service like `monitoring/prometheus-operated:9090`). Each person can still choose another; it's kept in their browser. See [Helm values](/server/helm-values).
## The Metrics page
Open it from the sidebar, or press G then U. It ranks what uses the most, and shows how that changed.
| Control | Options |
| - | - |
| **Time range** | 15m, 1h (the default), 6h, 24h, 7d |
| **Metric** | CPU, Memory, Network in, Network out, Restarts |
| **Group by** | Namespace, Workload, Pod, Node (not for restarts) |
| **Filter** | Words separated by commas, any of which may match, like `shop, data` |
| **Series shown** | The top 3, 5 or 7 (the default); the rest are added up as **Other** |
| **Chart** | Stacked or lines. Restarts are always bars. |
Under the chart:
* **Summary tiles.** **Now**, **Average** and **Peak** for the total, and either **Of allocatable, on average** (for the whole cluster) or the busiest group. For restarts: how many there were, how many pods (or workloads…) restarted, which restarted most, and how many times.
* **A distribution.** How the groups spread out. **Click a band to filter** the table to it.
* **A ranked table** of every group, with its now, average and peak, sortable.
The page follows the namespace menu, and keeps everything you pick in its address, so Back and Forward restore it.
## The Metrics tab
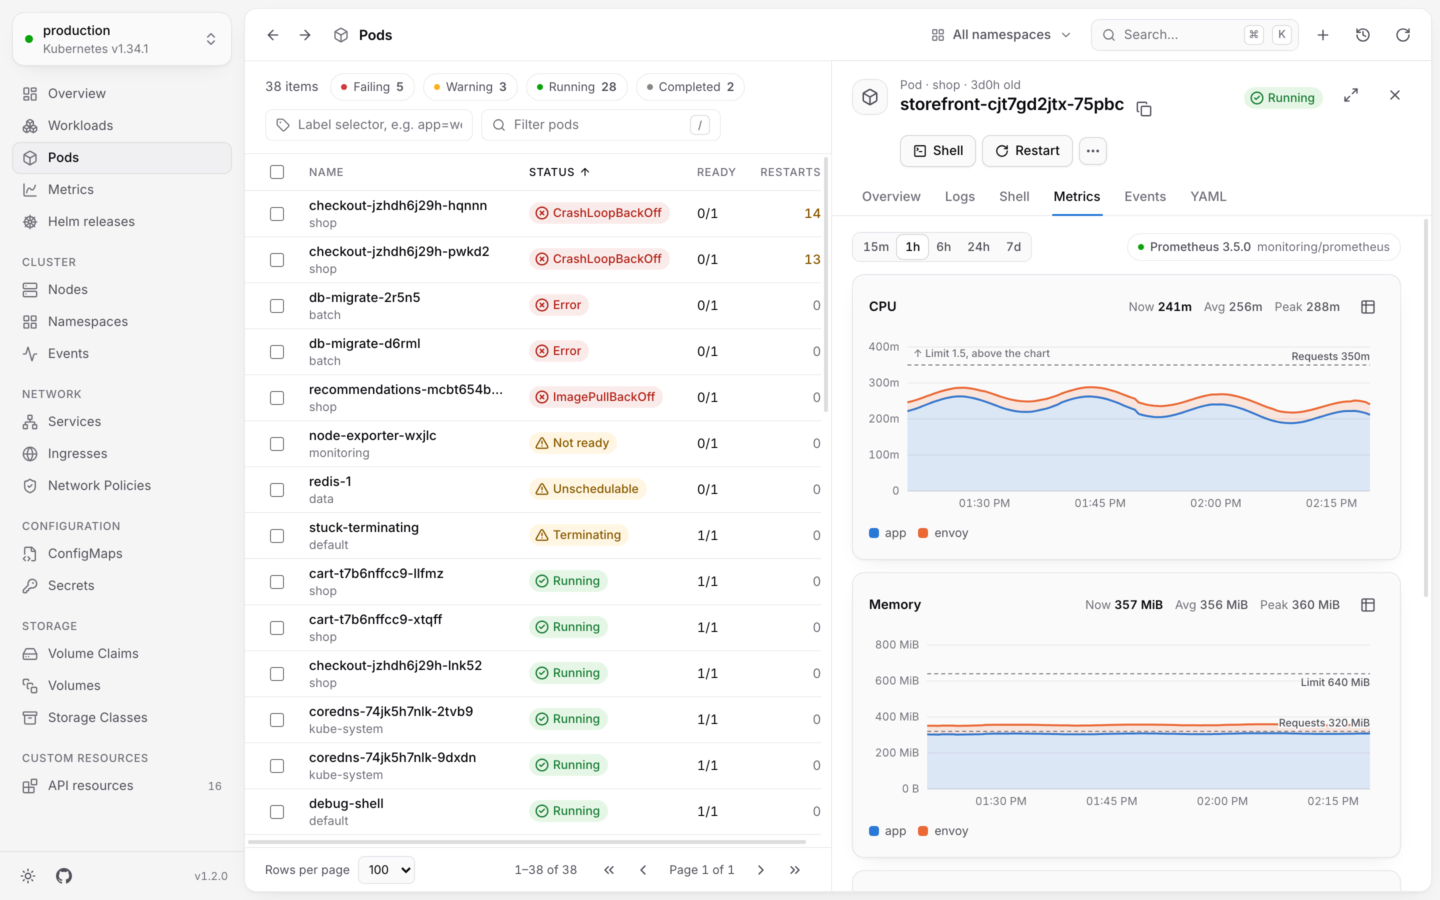
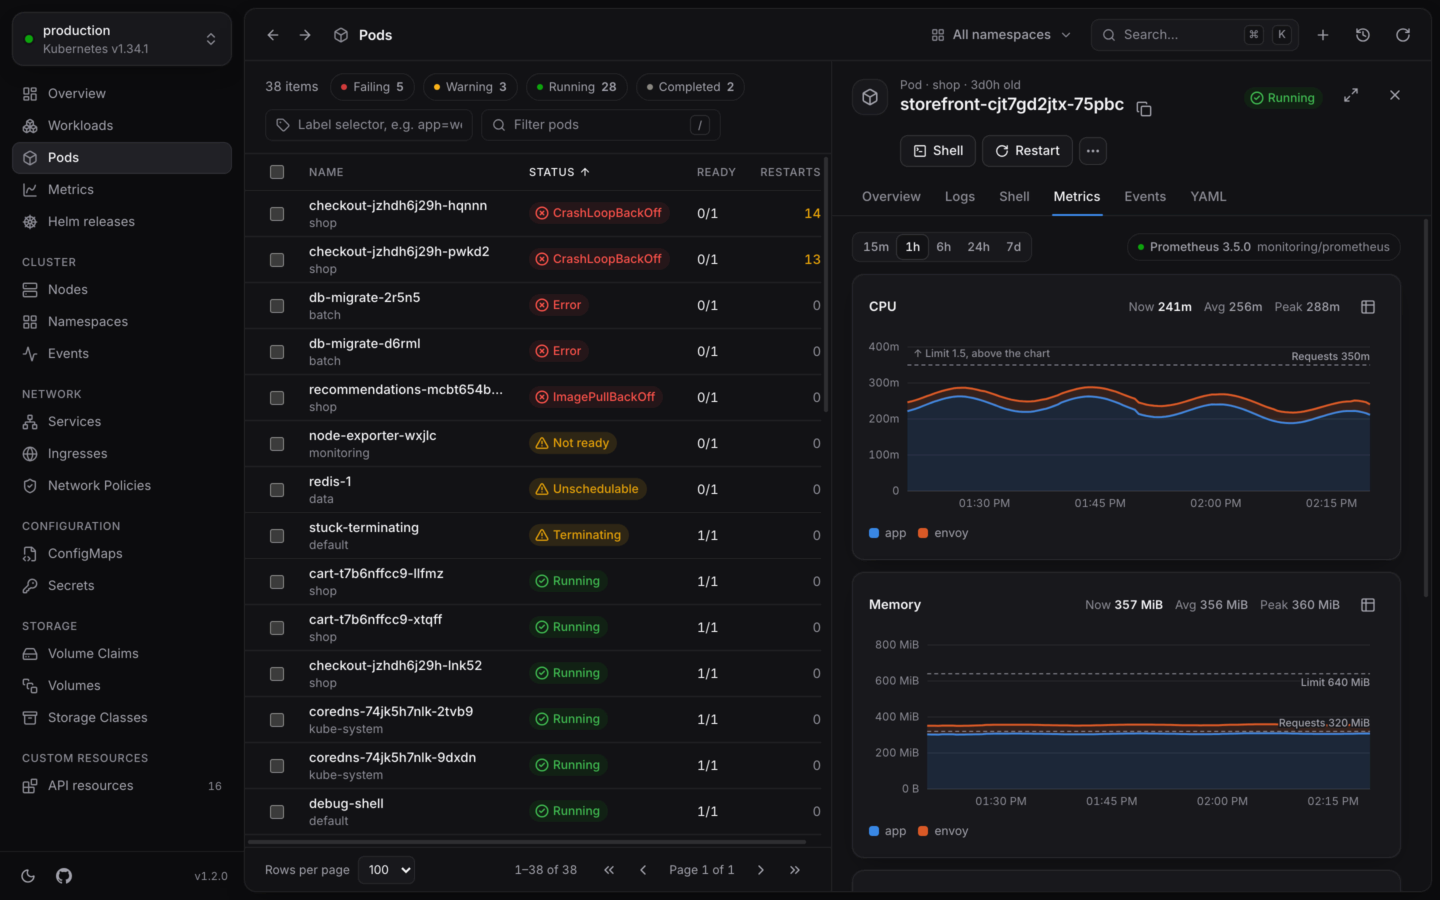
Pods, Deployments, StatefulSets, DaemonSets, ReplicaSets, Jobs, CronJobs and Nodes have a **Metrics** tab in their detail panel.
## What you need
* **A Prometheus-compatible server in the cluster.** Prometheus (as kube-prometheus-stack, the Prometheus chart or kube-prometheus install it) or VictoriaMetrics, single-node or cluster.
* **cAdvisor's metrics, scraped.** CPU, memory and network charts use the kubelet's `container_*` series. kube-prometheus-stack scrapes them out of the box.
* **kube-state-metrics**, for restarts. It also places pods on nodes when cAdvisor's series don't carry a `node` label.
* **Permission to reach it.** Your account needs `get` on `services/proxy` in the namespace the server runs in, and `list` on services to find it.
## How KubeStacks finds it
You usually don't have to do anything. Unless you've chosen a source, KubeStacks looks through the cluster's services for one that answers PromQL:
It skips services that come with Prometheus but don't answer queries themselves (Alertmanager, operators, exporters, kube-state-metrics, Grafana, VictoriaMetrics' agent and storage components, and so on), and rates the rest by their name and their `app.kubernetes.io/name` or `app` label:
| Score | Looks like | Port it uses |
| - | - | - |
| 90 | The Prometheus operator's service (`operated-prometheus: "true"`), or one named `prometheus`, `prometheus-operated`, `prometheus-server`, `prometheus-k8s` or `…-prometheus` | One named `web`, `http-web` or `http`, else 9090 or 80 |
| 85 | VictoriaMetrics single-node (`vmsingle`, `victoria-metrics`) | One named `http`, else 8429 or 8428 |
| 80 | VictoriaMetrics' `vmselect` | One named `http`, else 8481, with the path `/select/0/prometheus` |
| 60 | Anything else with Prometheus in its name or labels | As for 90 |
Services in a namespace named `monitoring`, `prometheus`, `observability` or `victoria-metrics` get 5 more.
In order, it sends each a trivial query. The first that answers is used. Its name and version show on the chip at the top of every chart.
If yours runs under a name KubeStacks doesn't recognize, or you have several and want another, choose it yourself.
## Choosing the source
Open **Metrics source** from the chip on any chart, or from the command palette (⌘K, then "Metrics source"). ⌘ is Ctrl on Windows and Linux.
The default. KubeStacks looks for Prometheus and VictoriaMetrics among the cluster's services, as described above.
A Prometheus-compatible service in the cluster, reached through the API server. Pick its **Namespace**, **Service** and **Port**, and a **Path** if it serves PromQL below the root:
| Server | Path |
| - | - |
| Prometheus, VictoriaMetrics single-node | Leave it empty |
| VictoriaMetrics `vmselect` | `/select/0/prometheus` |
**Test** asks it right away, and says what answered and its version. **Save** tests it again, and saves only if it answers. If KubeStacks can't list namespaces or services, the fields become text you type.
Live usage only, from the metrics API. Charts are replaced by a note saying history is off.
The choice is kept per cluster.
**In your cluster:** the administrator sets the default for everyone with the chart's `metrics.source` (`auto`, `off`, or a service like `monitoring/prometheus-operated:9090`). Each person can still choose another; it's kept in their browser. See [Helm values](/server/helm-values).
## The Metrics page
Open it from the sidebar, or press G then U. It ranks what uses the most, and shows how that changed.
| Control | Options |
| - | - |
| **Time range** | 15m, 1h (the default), 6h, 24h, 7d |
| **Metric** | CPU, Memory, Network in, Network out, Restarts |
| **Group by** | Namespace, Workload, Pod, Node (not for restarts) |
| **Filter** | Words separated by commas, any of which may match, like `shop, data` |
| **Series shown** | The top 3, 5 or 7 (the default); the rest are added up as **Other** |
| **Chart** | Stacked or lines. Restarts are always bars. |
Under the chart:
* **Summary tiles.** **Now**, **Average** and **Peak** for the total, and either **Of allocatable, on average** (for the whole cluster) or the busiest group. For restarts: how many there were, how many pods (or workloads…) restarted, which restarted most, and how many times.
* **A distribution.** How the groups spread out. **Click a band to filter** the table to it.
* **A ranked table** of every group, with its now, average and peak, sortable.
The page follows the namespace menu, and keeps everything you pick in its address, so Back and Forward restore it.
## The Metrics tab
Pods, Deployments, StatefulSets, DaemonSets, ReplicaSets, Jobs, CronJobs and Nodes have a **Metrics** tab in their detail panel.
 | Object | Charts |
| - | - |
| **Pod** | CPU and memory per container, against the pod's requests and limit; network; restarts |
| **Workload** | CPU and memory per pod, against each pod's requests and limit; network; restarts |
| **Node** | CPU and memory by namespace, against what the node can allocate; network |
A limit line appears only when every container has a limit, since without one there's no ceiling to draw.
## Reading the charts
* **Zoom in** by dragging across any chart. **Reset zoom** goes back to the range you picked.
* **Read values** by hovering, or with ← →, Home and End when the chart has focus. Esc hides the readout.
* **Show or hide a series** by clicking it in the legend. Alt-, ⌘- or Shift-click shows only that one.
Each range has its own resolution, and charts refresh on their own while you look:
| Range | One point every | Refreshes every |
| - | - | - |
| Last 15 minutes | 15 seconds | 30 seconds |
| Last hour | 30 seconds | 30 seconds |
| Last 6 hours | 2 minutes | 1 minute |
| Last 24 hours | 5 minutes | 5 minutes |
| Last 7 days | 30 minutes | 10 minutes |
## When there's no history
Where a chart would be, KubeStacks says why, and what to do:
| You see | It means | Try |
| - | - | - |
| **No Prometheus found** | No service looked like Prometheus or VictoriaMetrics | **Choose a service**, if yours runs under another name |
| **Usage history is off** | Someone chose **Don't use history** for this cluster | **Change** |
| **Can't read usage history** | The source stopped answering, or your account can't reach it | **Look again**, or check you have `get` on `services/proxy` |
A chart that's empty for a time usually means Prometheus has no samples for it: the object wasn't running yet, or cAdvisor isn't scraped. Restarts come from kube-state-metrics, so without it that chart stays empty.
What's in use right now, from metrics-server.
The RBAC behind each feature, history included.
This documentation is built and hosted on [Mintlify](https://mintlify.com), a developer documentation platform.
| Object | Charts |
| - | - |
| **Pod** | CPU and memory per container, against the pod's requests and limit; network; restarts |
| **Workload** | CPU and memory per pod, against each pod's requests and limit; network; restarts |
| **Node** | CPU and memory by namespace, against what the node can allocate; network |
A limit line appears only when every container has a limit, since without one there's no ceiling to draw.
## Reading the charts
* **Zoom in** by dragging across any chart. **Reset zoom** goes back to the range you picked.
* **Read values** by hovering, or with ← →, Home and End when the chart has focus. Esc hides the readout.
* **Show or hide a series** by clicking it in the legend. Alt-, ⌘- or Shift-click shows only that one.
Each range has its own resolution, and charts refresh on their own while you look:
| Range | One point every | Refreshes every |
| - | - | - |
| Last 15 minutes | 15 seconds | 30 seconds |
| Last hour | 30 seconds | 30 seconds |
| Last 6 hours | 2 minutes | 1 minute |
| Last 24 hours | 5 minutes | 5 minutes |
| Last 7 days | 30 minutes | 10 minutes |
## When there's no history
Where a chart would be, KubeStacks says why, and what to do:
| You see | It means | Try |
| - | - | - |
| **No Prometheus found** | No service looked like Prometheus or VictoriaMetrics | **Choose a service**, if yours runs under another name |
| **Usage history is off** | Someone chose **Don't use history** for this cluster | **Change** |
| **Can't read usage history** | The source stopped answering, or your account can't reach it | **Look again**, or check you have `get` on `services/proxy` |
A chart that's empty for a time usually means Prometheus has no samples for it: the object wasn't running yet, or cAdvisor isn't scraped. Restarts come from kube-state-metrics, so without it that chart stays empty.
What's in use right now, from metrics-server.
The RBAC behind each feature, history included.
This documentation is built and hosted on [Mintlify](https://mintlify.com), a developer documentation platform.