

A cluster that doesn't answer, and what to try.
Connecting to a cluster
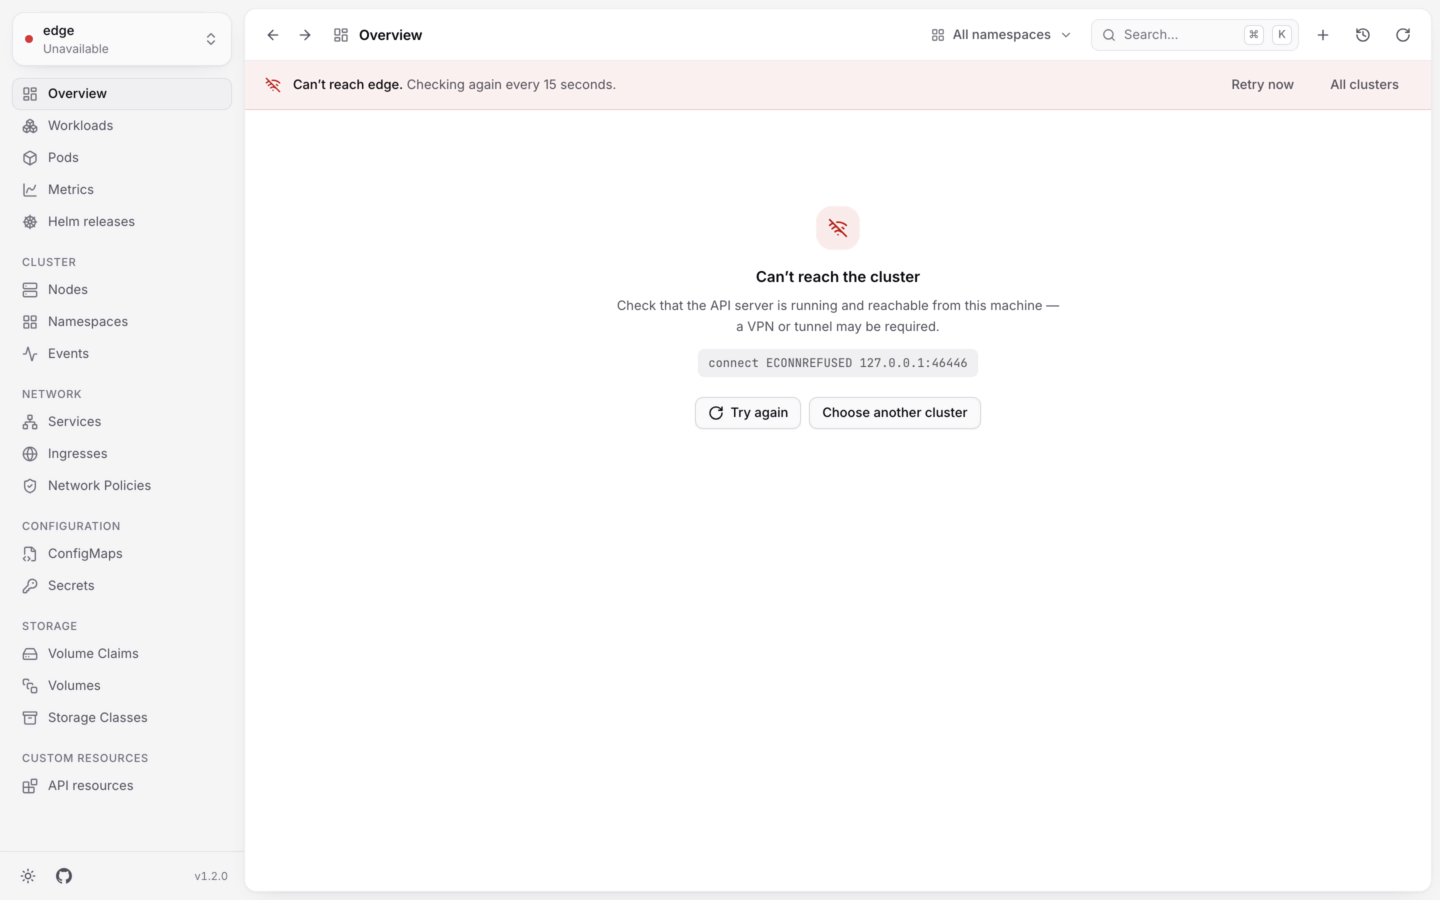
Unreachable: Can't reach the cluster
Unreachable: Can't reach the cluster
- Check that the cluster is running, and that this computer can reach it. Many clusters are only reachable over a VPN or a tunnel.
- If you have
kubectl,kubectl --context <name> get --raw /versiontells you whether the API server answers from this computer. - Choose Try again, or Reload on the start screen, once the network is back.
Timed out: The cluster isn't responding
Timed out: The cluster isn't responding
KUBESTACKS_REQUEST_TIMEOUT_MS:Certificate error: The cluster's certificate couldn't be verified
Certificate error: The cluster's certificate couldn't be verified
TLS handshake failed.This happens when a cluster is recreated or its certificates rotate. Get a fresh kubeconfig entry from wherever the cluster came from, for example aws eks update-kubeconfig, gcloud container clusters get-credentials or az aks get-credentials, then choose Reload.Plain HTTP blocked: Plain HTTP isn't allowed
Plain HTTP blocked: Plain HTTP isn't allowed
http://, for example through kubectl proxy. KubeStacks only uses unencrypted connections when the kubeconfig says so for that cluster, the same rule as the official JavaScript client:Credentials failed: Couldn't get credentials
Credentials failed: Couldn't get credentials
gke-gcloud-auth-plugin, aws eks get-token or kubelogin, and the plugin failed.- The credential plugin “…” wasn’t found. Install the plugin, or make sure it’s on your
PATH. On macOS and Linux, KubeStacks readsPATHfrom your login shell when it starts, even when you open it from the Dock or a launcher. So the plugin must be on thePATHyour shell profile sets up. Restart KubeStacks after changing it. - Could not get credentials: … The plugin ran but failed, most often because you’re signed out of your cloud provider. Sign in again (
gcloud auth login,aws sso login,az login…), then choose Try again.
Forbidden: Access denied
Forbidden: Access denied
Your kubeconfig couldn't be read, or no clusters found
Your kubeconfig couldn't be read, or no clusters found
- Your kubeconfig couldn’t be read. A file has a syntax error. KubeStacks names the file and the first line of the problem. Fix the file, then choose Reload.
- No clusters found. KubeStacks found no contexts. Set
KUBECONFIG, or create~/.kube/config, then reload. See Connecting clusters.
Clusters are missing, though kubectl sees them
Clusters are missing, though kubectl sees them
kubectl in your terminal uses the KUBECONFIG your shell profile exports. KubeStacks opened from the Dock, Spotlight or a launcher doesn’t see that variable (it takes only PATH from your shell), so it reads ~/.kube/config. Loaded from, at the bottom of the start screen, shows which files it read.Start KubeStacks from your terminal, or set KUBECONFIG where apps see it. See Setting environment variables.While you work
A list stops at 5,000 objects
A list stops at 5,000 objects
KUBESTACKS_MAX_LIST_ITEMS.An action is grayed out
An action is grayed out
- Your account can’t … in …. Your RBAC doesn’t allow it. See Permissions.
- Changes are turned off for this cluster. You, or
KUBESTACKS_READ_ONLY, made it read-only. See Read-only mode.
It changed in the meantime
It changed in the meantime
A shell says the container has no shell
A shell says the container has no shell
A port can't be forwarded
A port can't be forwarded
Something went wrong
Something went wrong
Usage and metrics
No live CPU or memory
No live CPU or memory
kubectl top. Without it, the overview says Live usage needs metrics-server, and KubeStacks shows requests and limits against capacity instead. Install metrics-server in the cluster to see live usage. See Live usage.No usage history
No usage history
- No Prometheus found. KubeStacks looked among the cluster’s services and found none that answered. Choose Choose a service to pick its namespace, service, port and path (
/select/0/prometheusfor vmselect), or Look again. - Can’t read usage history. The source is there, but reading it failed. Your account needs
getonservices/proxyin the source’s namespace, because KubeStacks reaches it through the API server with your credentials. - Usage history is off. It was turned off for this cluster. Choose Change to turn it back on.
Helm
KubeStacks couldn't run helm
KubeStacks couldn't run helm
helm. Install Helm, or set KUBESTACKS_HELM to where it is. On macOS and Linux, helm must be on your login shell’s PATH.Helm couldn't do it
Helm couldn't do it
helm said. A failed upgrade is often a chart or values problem, which the dry run usually catches first.If the release is managed by Flux, KubeStacks says so and links to its HelmRelease. Flux puts back changes made any other way, so make the change in Flux instead.Installing
Windows says it protected your PC
Windows says it protected your PC
The AppImage doesn't start
The AppImage doesn't start
chmod +x KubeStacks-*.AppImage. Then run it from a terminal to see any error it prints.In your cluster
Pages keep reconnecting
Pages keep reconnecting
KUBESTACKS_HEARTBEAT_SECONDS). Keep that shorter than the idle timeouts of the proxies in between. See Address and ingress.Everyone was signed out
Everyone was signed out
The cluster doesn't accept this token
The cluster doesn't accept this token
kubectl create token NAME --namespace NAMESPACE. KubeStacks asks the cluster who a token belongs to with a SelfSubjectReview, which needs Kubernetes 1.28 or later. See Tokens.Your session ended
Your session ended
Reporting a problem
If none of this helps, please open an issue. In the desktop app, Help → Report an Issue… opens the same page. It helps to include:- your KubeStacks version, shown at the bottom of the sidebar,
- your operating system, and how the cluster is run (EKS, GKE, kind…),
- what you did, what you expected, and what happened instead,
- the details from the error screen, which Copy details copies.