

kubectl top reads from. It’s served by metrics-server, which most managed clusters run already. KubeStacks asks for it every 5 seconds while its window is open, and needs nothing else installed.
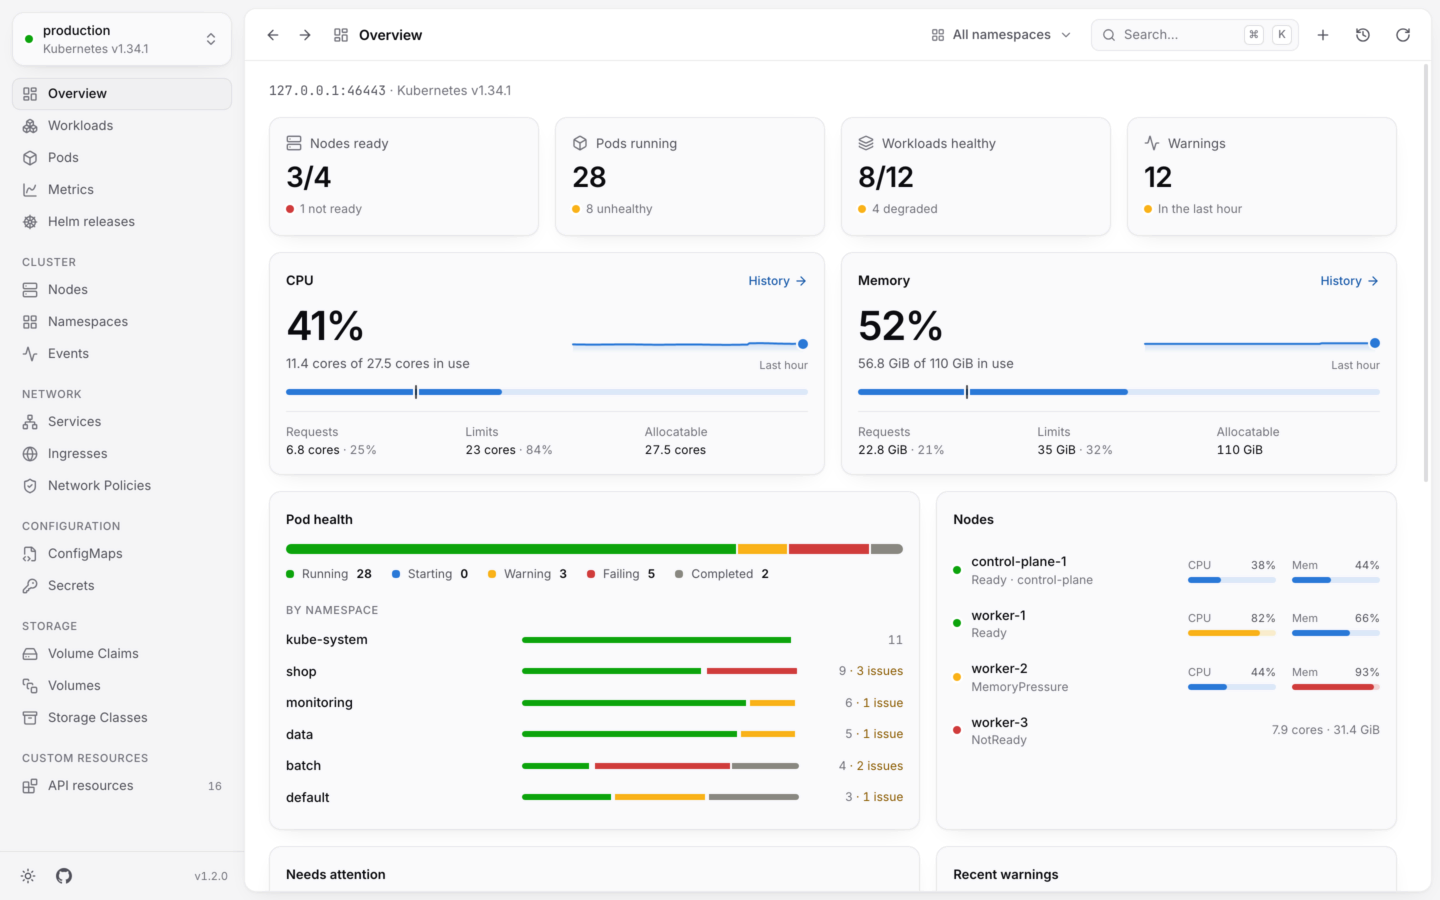
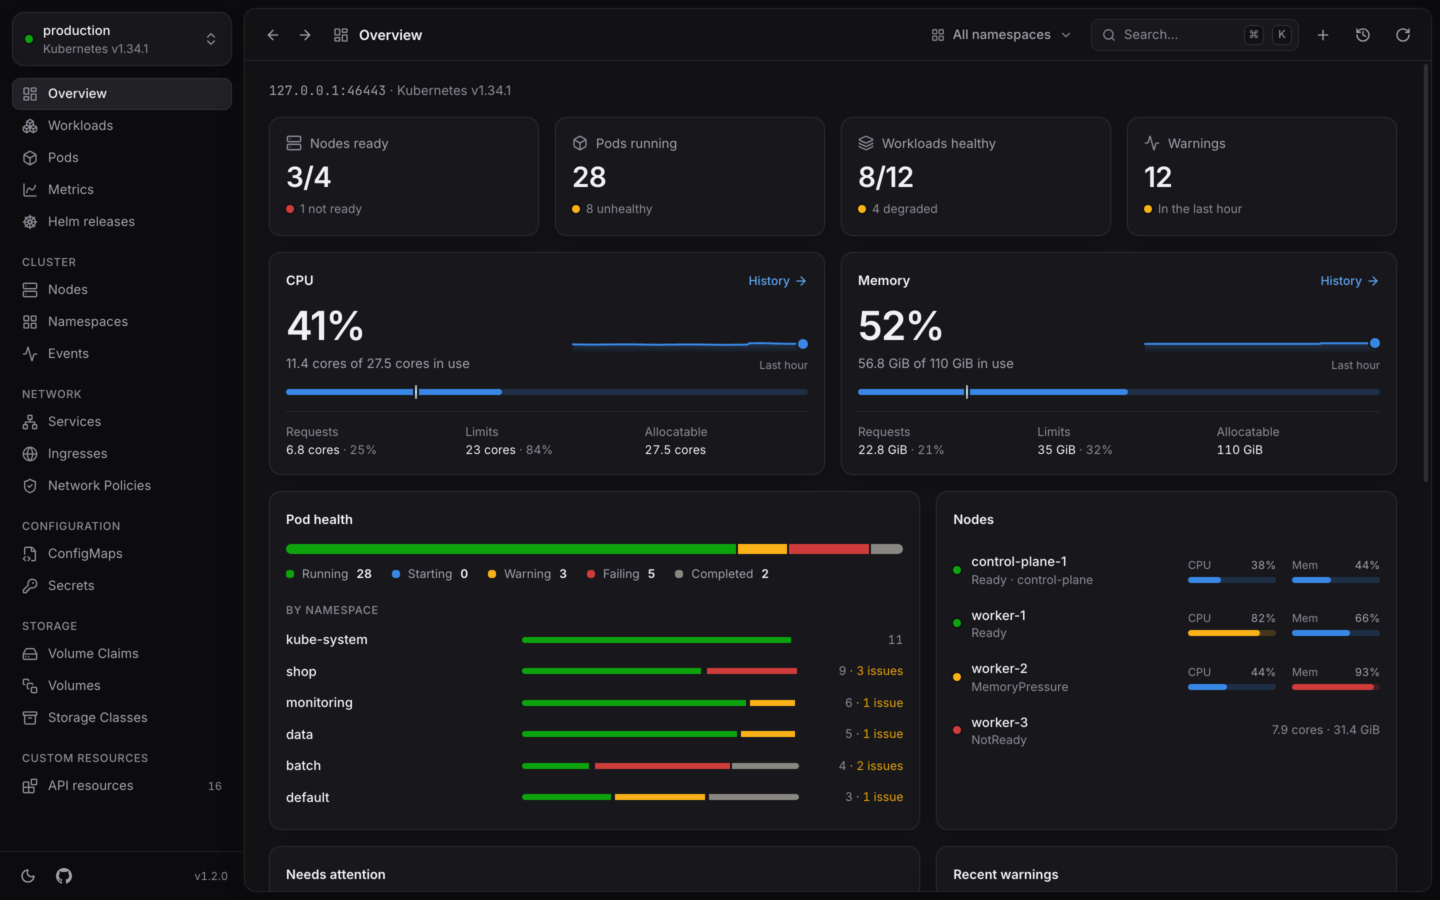
The overview's CPU and memory cards: what's in use, against requests, limits and allocatable.
Where you see it
The overview's CPU and Memory cards
The overview's CPU and Memory cards
Each card leads with how much of the cluster is in use, as a percentage and as “12.2 cores of 27.5 cores in use”. The meter below it marks where requests reach, and the row underneath lists:
Pods that have finished (Succeeded or Failed) don’t count, since they no longer hold anything.The small chart beside the number is a trend. With usage history, it covers the last hour, and History → opens the Metrics page. Without it, it covers the time Since you opened it.
Nodes and the busiest pods
Nodes and the busiest pods
The overview’s Nodes card has a CPU and a memory meter for each node, against what that node can allocate. Top CPU and Top memory list the five pods using the most.The Nodes list has the same meters in its CPU and Memory columns, and you can sort by them.
Pods and workloads
Pods and workloads
The Pods list has CPU and Memory columns, sortable, so the hungriest pods are a click away. In Workloads, each workload’s usage is added up over its pods. A pod’s detail panel shows each container’s usage next to its state.
Without metrics-server
Everything else keeps working. Where usage would be, KubeStacks shows what it can work out from the cluster itself:- The overview’s cards show what’s requested instead of what’s used (“6.8 cores of 27.5 cores requested”), with the note Live usage needs metrics-server.
- The Nodes list shows each node’s allocatable CPU and memory instead of a meter.
- Pods’ CPU and Memory columns stay empty, and Top CPU and Top memory don’t appear.
Install metrics-server
If your cluster doesn’t have it, metrics-server’s own chart or manifest installs it in a minute. It goes inkube-system.
- Helm
- kubectl
Live usage and history
Live usage is a snapshot, a few seconds old. To see how usage changed over the last hour, day or week, and compare namespaces, workloads, pods or nodes, KubeStacks charts history from a Prometheus or VictoriaMetrics in the cluster.Usage history
The Metrics page, and a Metrics tab on pods, workloads and nodes.
The overview
Everything else on a cluster’s first page.