

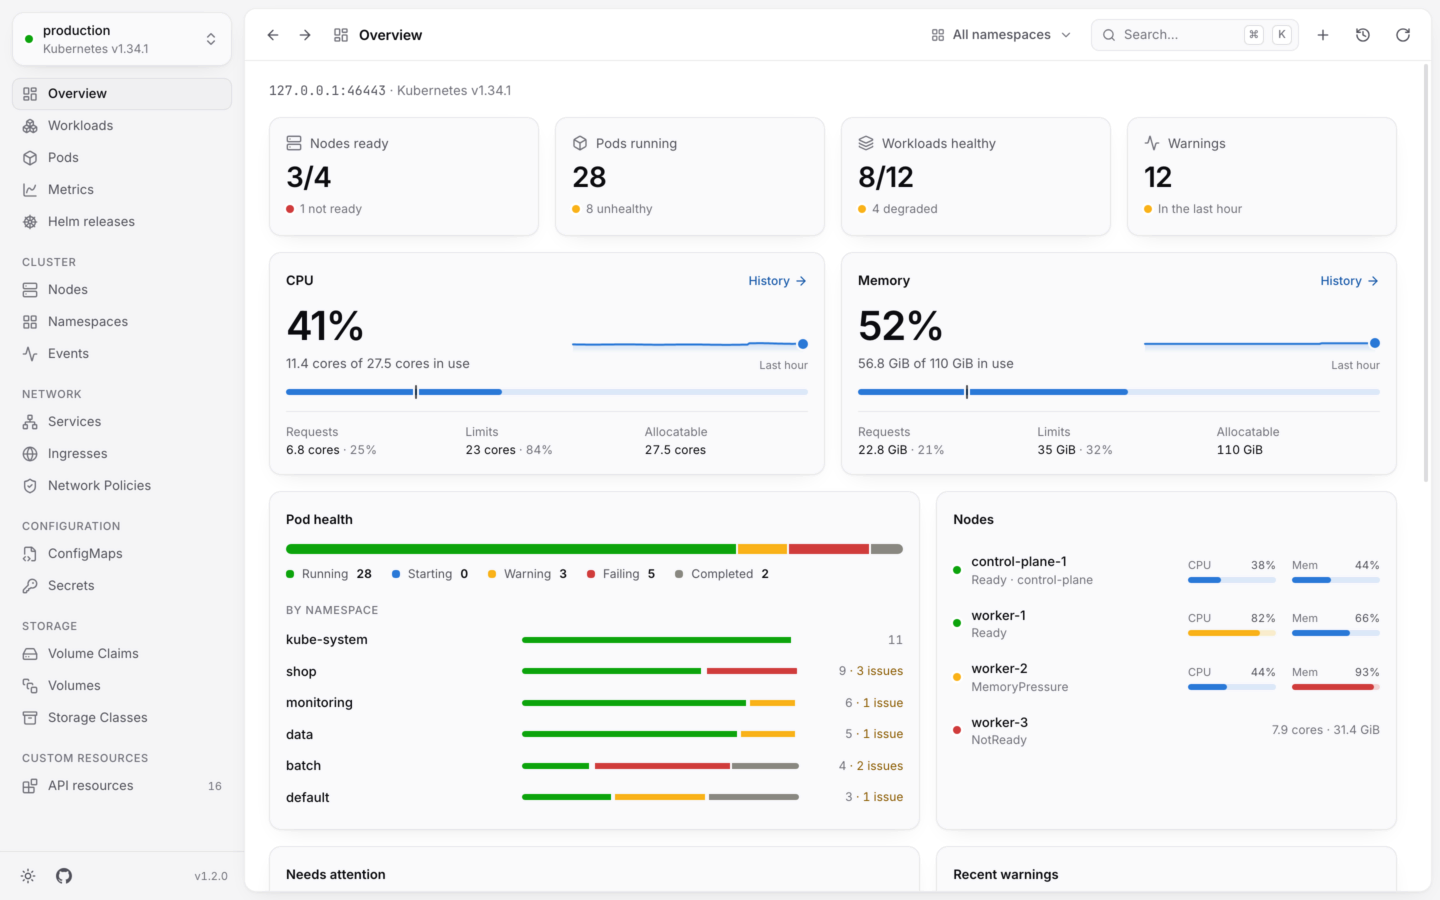
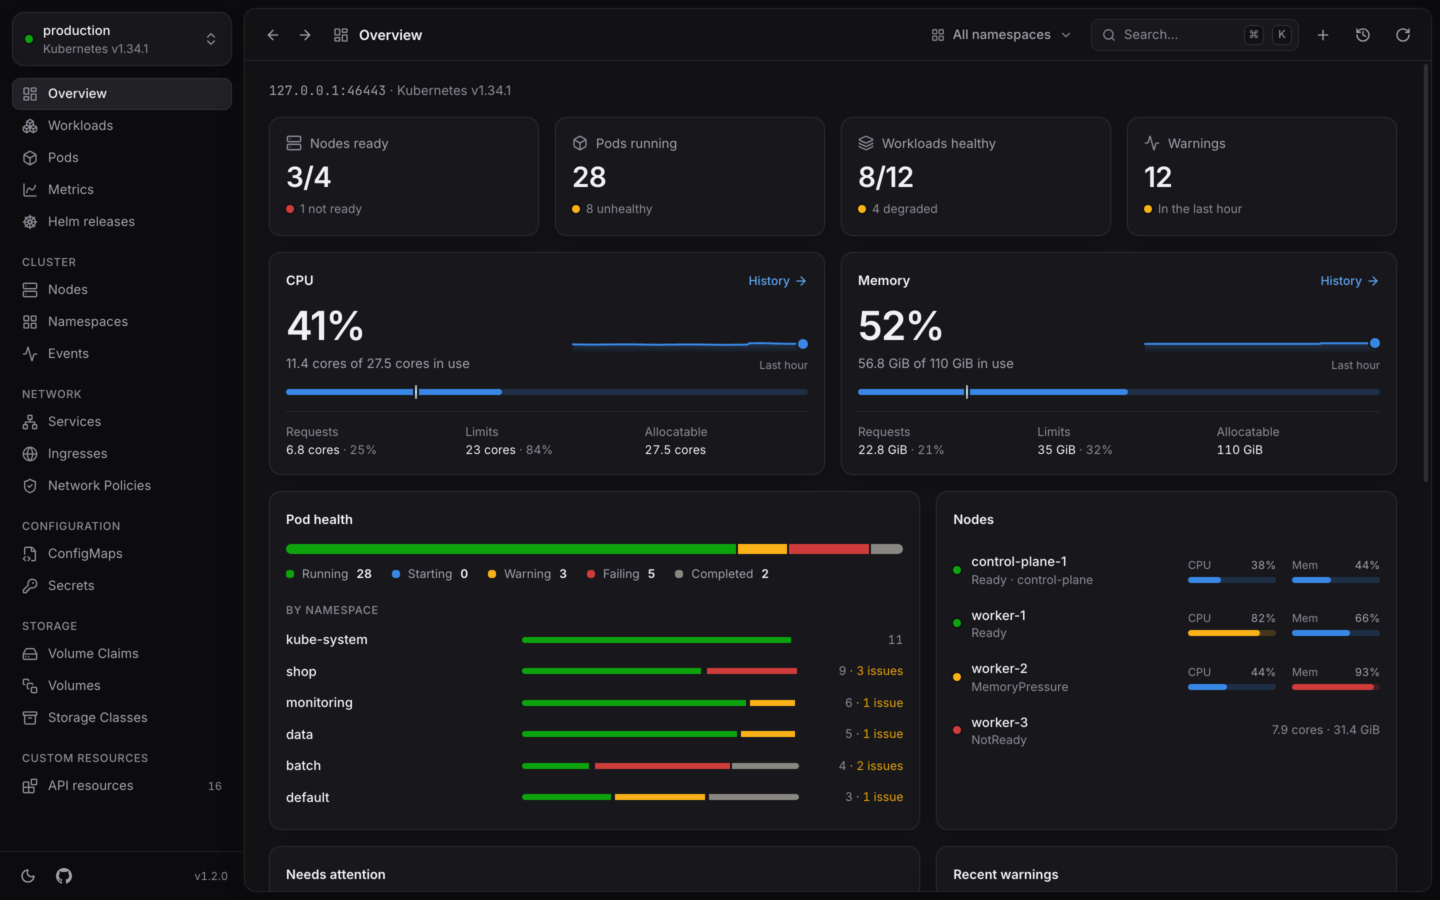
Nodes, pods and workloads, CPU and memory with their last hour, and what needs attention.
The four numbers
Each tile opens its list. When something’s wrong, the list opens filtered to what’s failing or warning, so the problems are all you see. Warnings opens the events, showing only warnings.
CPU and memory
Two cards show how much of the cluster’s CPU and memory is in use, as a percentage of what the nodes can give (their allocatable capacity), and as 11.4 cores of 27.5 cores in use.- The meter shows usage, with a mark for what pods have requested.
- The sparkline shows the Last hour when KubeStacks has found your usage history, or the usage Since you opened it when it hasn’t.
- Requests, Limits and Allocatable add up what every pod asks for and is capped at, against what the nodes offer, with each as a share of allocatable.
- History opens the Metrics page for a longer view.
Pod health
A bar shows every pod by state: Running, Starting, Warning, Failing and Completed, with a count for each. Under it, By namespace shows the six namespaces with the most pods the same way, with how many issues each has, so a namespace in trouble stands out. Click a namespace to switch to it.Nodes
Every node with its status, and meters for its CPU and memory use. A node under pressure, cordoned or not ready says so. Click one to open it. See Nodes.Needs attention
The pods and workloads (Deployments, StatefulSets and DaemonSets) that aren’t healthy, most urgent first. It shows six, with Show all for the rest. Click one to open it. When nothing’s wrong, it says Everything looks healthy.Recent warnings
The six latest warning events, with their reason and message. Click one to open the object it’s about. When there are none: No warnings. Nice.Top CPU and Top memory
The five pods using the most CPU, and the five using the most memory, right now. They’re often the first place to look when a node is under pressure. These need metrics-server, and appear once pods report usage.Health and status
How KubeStacks decides what’s healthy, and what each status means.
Workloads
Every workload in one list, problems first.