

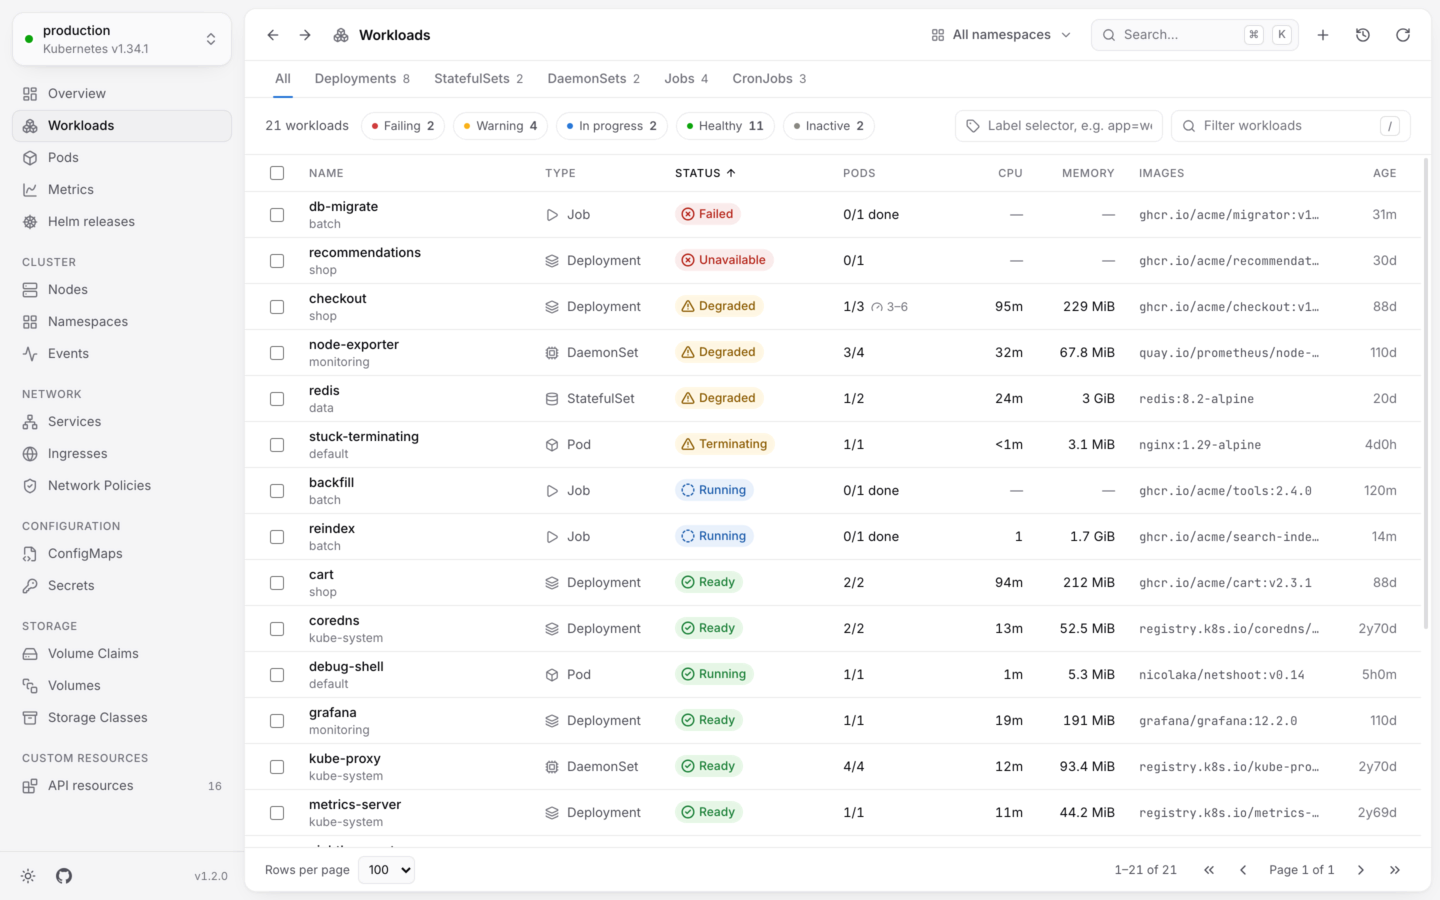
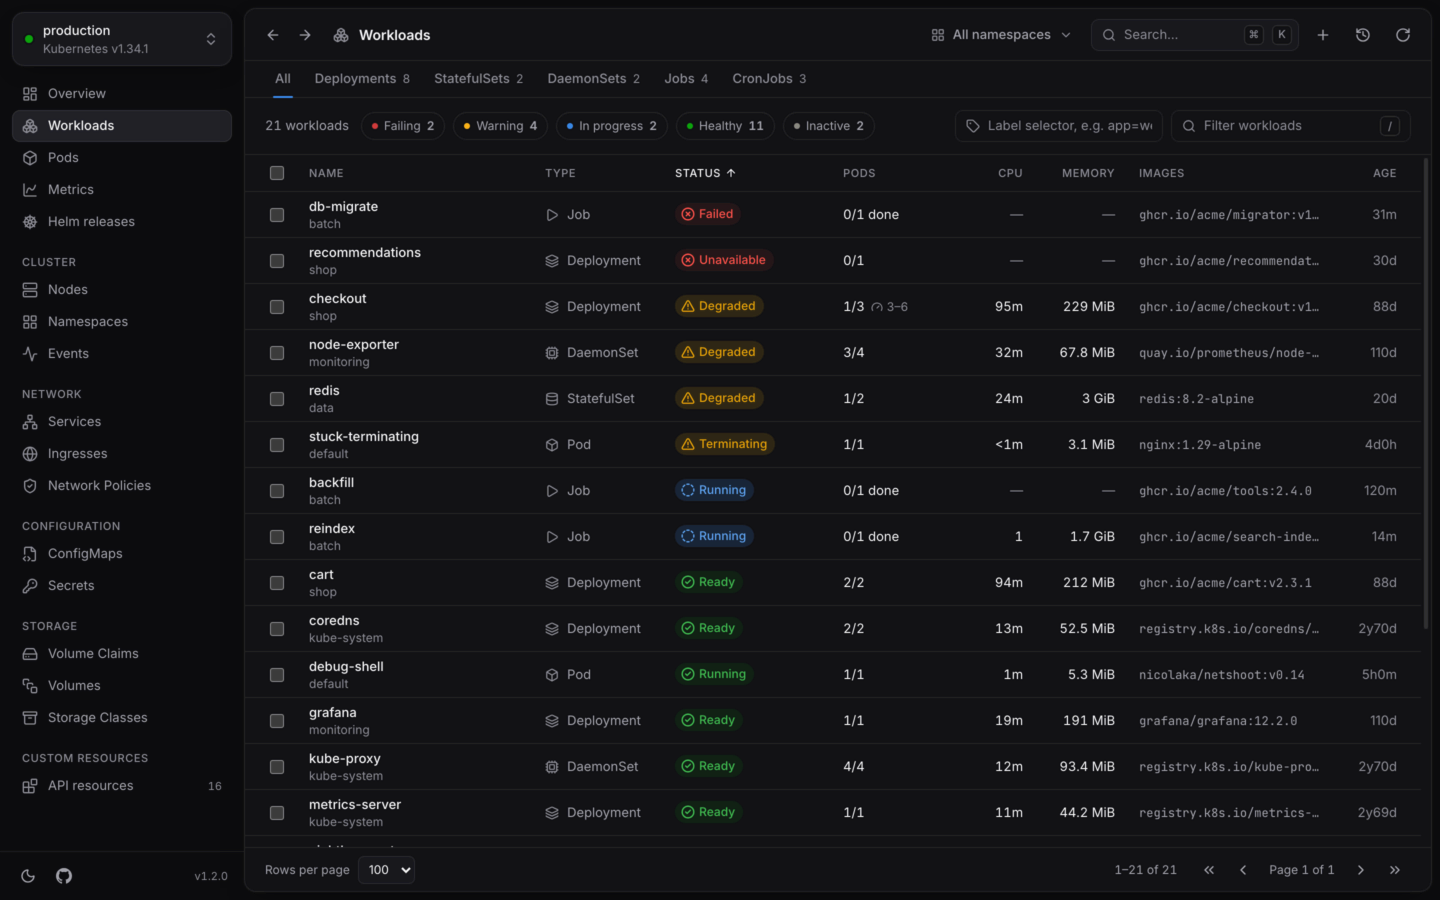
Every workload, whatever its kind, in one list, with its health.
What’s in the list
Every Deployment, StatefulSet, DaemonSet and CronJob, plus the Jobs, ReplicaSets and pods that nothing manages. Objects that only exist to run another are left out, so each workload appears once: the ReplicaSets a Deployment runs, and the Jobs a CronJob starts. You can still open any of them from the command palette (⌘K), and every pod links to what controls it.
Lists sort by status first, the most urgent at the top. Click any column to sort by it instead.
One kind at a time
The tabs above the list show each kind on its own, with a count, and with the columns that matter for that kind:
ReplicaSets and HorizontalPodAutoscalers have lists of their own too. They aren’t in the sidebar, so find them by name in the command palette.
Narrow it down
- Health. The chips above the list (Failing, Warning, In progress, Healthy, Inactive) show only workloads in that state. Pick several to combine them.
- Filter. Press / and type. Filter workloads matches names, namespaces, kinds, labels written as
key=value, and images, songinx:1.27finds everything running that image. - Label selector. Type a selector like
app=web,tier!=cacheand press ↵. The cluster does the filtering, which helps in big clusters.
Open a workload
Click a row, or move to it with ↑ ↓ and press ↵. Its details open next to the list.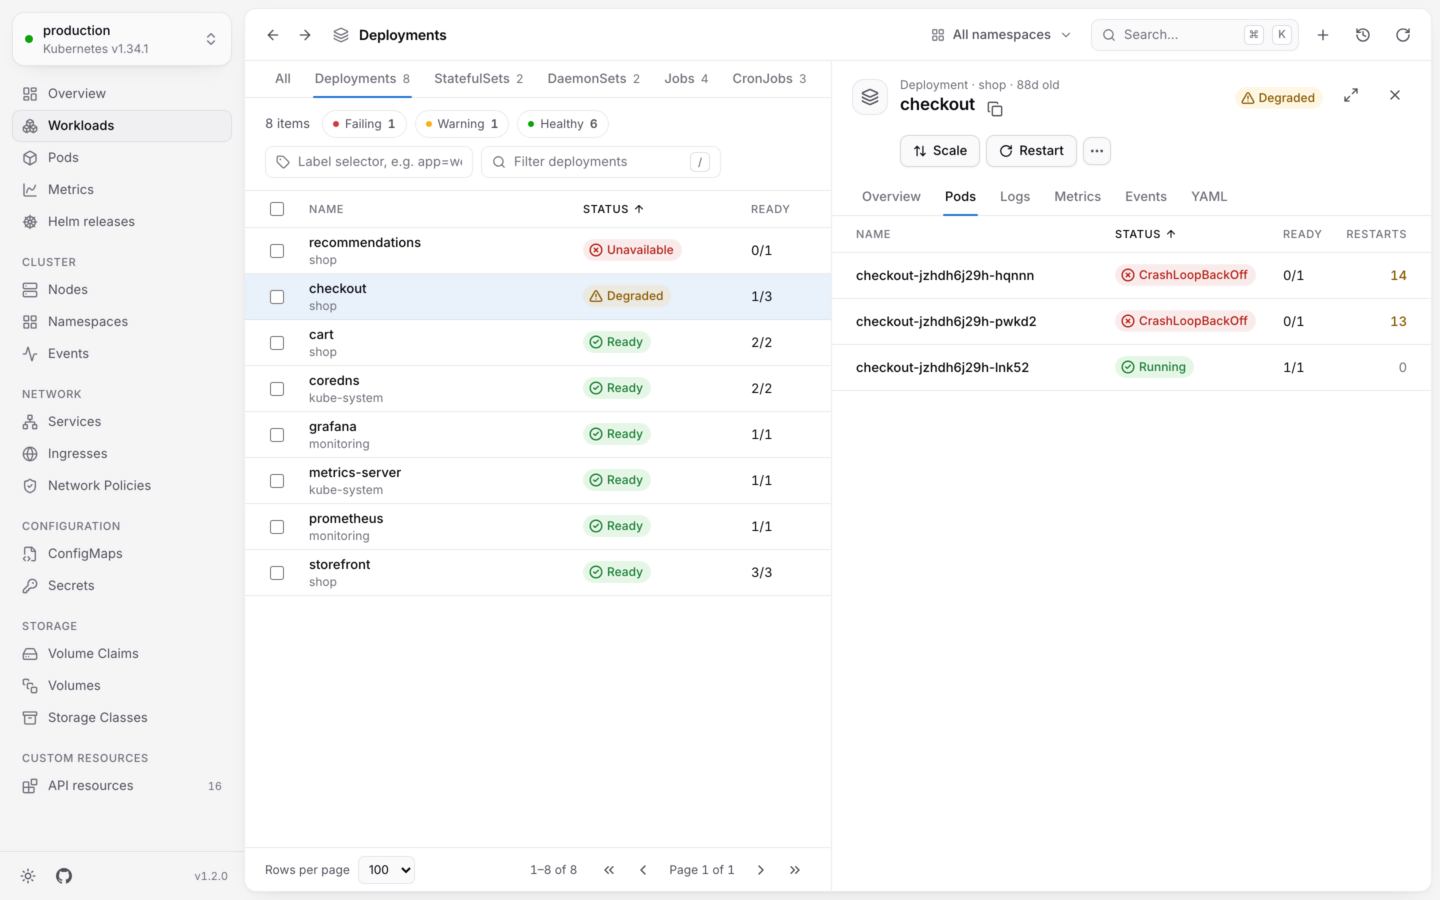
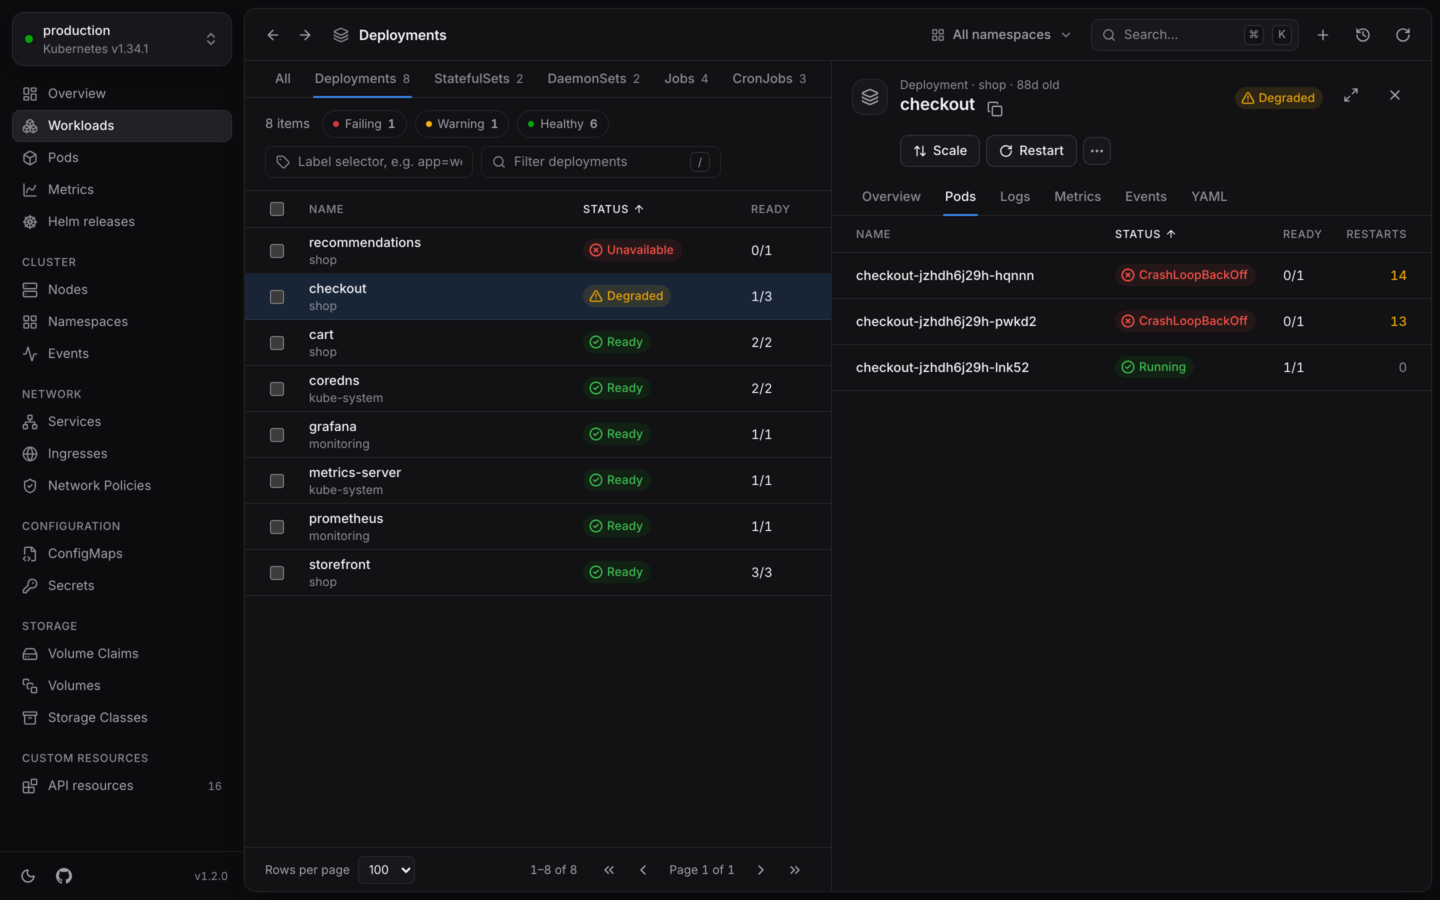
A failing deployment, with its pods and why they're restarting.
- Overview has its replicas (wanted, updated and available), update strategy and selector, the images in its pod template, its conditions, labels and annotations.
- Pods lists the pods it runs, failing ones first.
- Logs streams every pod’s logs, merged in the order they were written. See Logs.
- Metrics charts its CPU and memory over time against its requests and limits. See Usage history.
- Events and YAML, as for any object.
Act on it
The common actions are buttons in the panel, and the rest are under ⋯ (or press .): scale, restart, change images, roll back, pause a rollout, run a CronJob now, suspend or resume. Right-click a row for the same actions without opening it. To act on several at once, pick rows with X or Shift-click, and choose from the bar that appears. Restart, suspend, resume and delete work across kinds.Actions by kind
Everything you can do to a workload, and what each does.
Several at once
Restart, suspend or delete many workloads together.